
June 2023
June visitation decreased year-over-year by 9.7% or 12,177 visitors
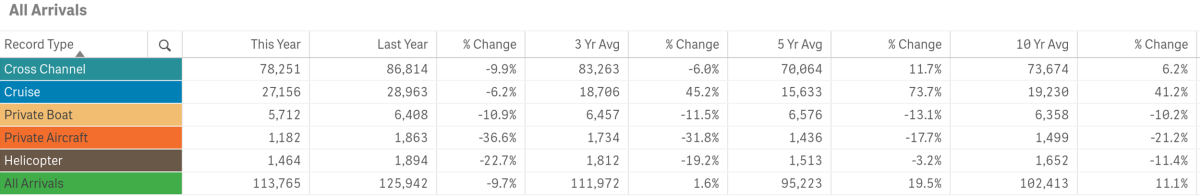
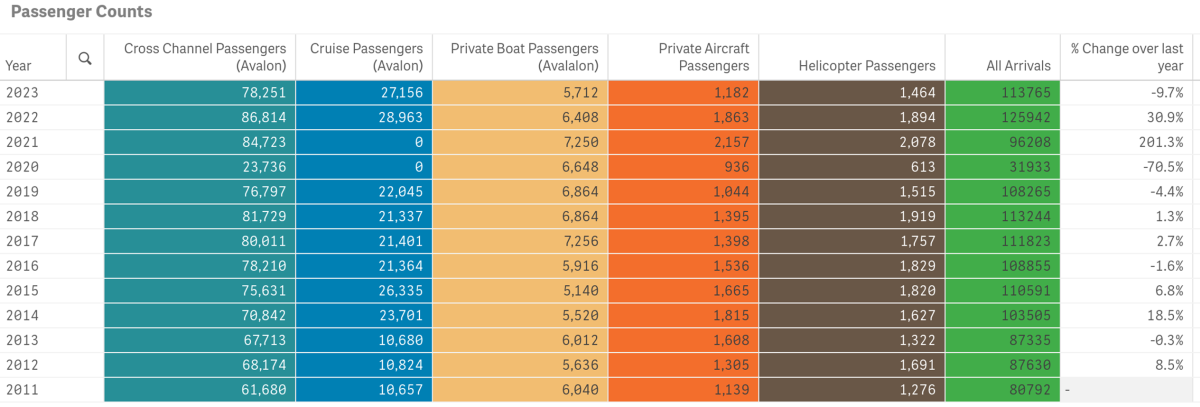
Previous tracking (below) for the month of June offers a comparison with and without COVID-19 impacts. June 2023 was below the peak visitation for the month recorded last year @ 125,942 travelers.
June’s total in-bound passenger count was above the three, five and ten-year averages for the month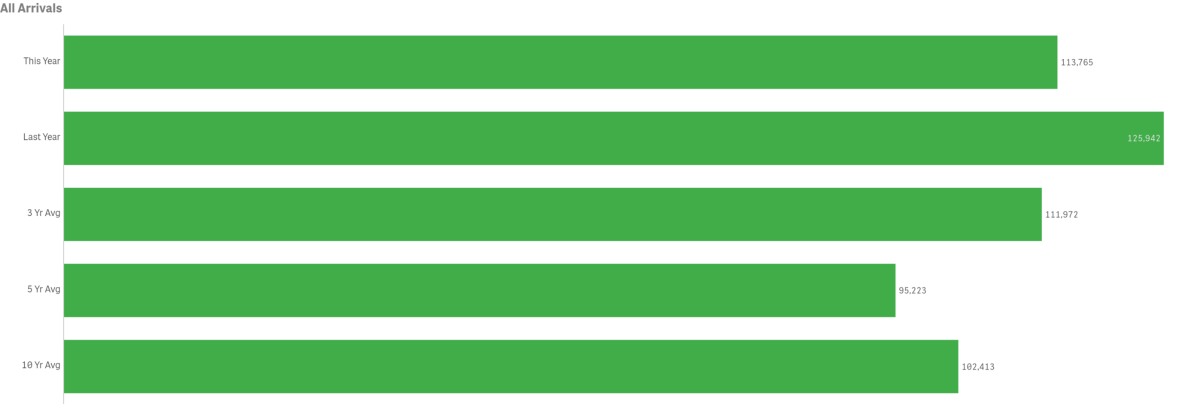
Arrivals by Sea
Passengers arriving by sea, totaled 111,119 for the month, a decrease of 9.1% from last year.
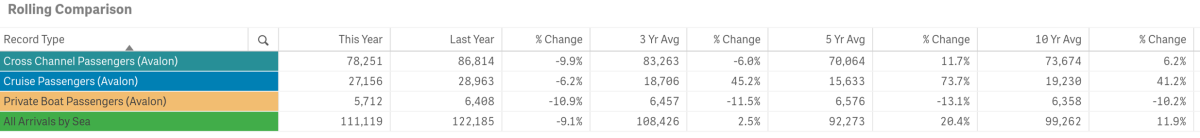
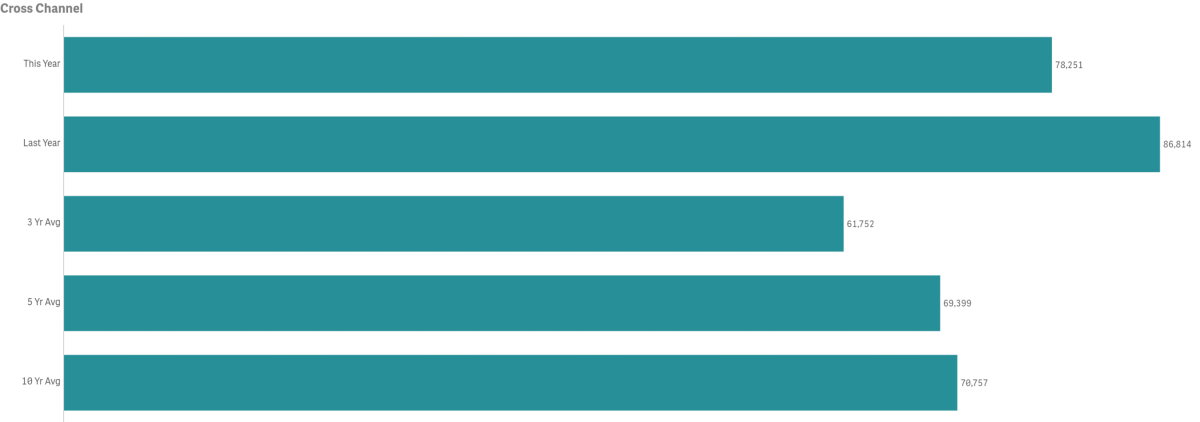
Cross Channel Passenger counts were down year-over-year by 9.9% or a decrease of 2,563 people
- 2000 had the highest volume for the month @ 89,440 passengers
- 2020 had the lowest volume for the month @ 23,736
- June Cross Channel Passenger counts were below the three-year average by 6.0%, but above the five and ten-year averages by 11.7% and 6.2% respectively
- Cross Channel Passengers made up 68.8% of total monthly arrivals
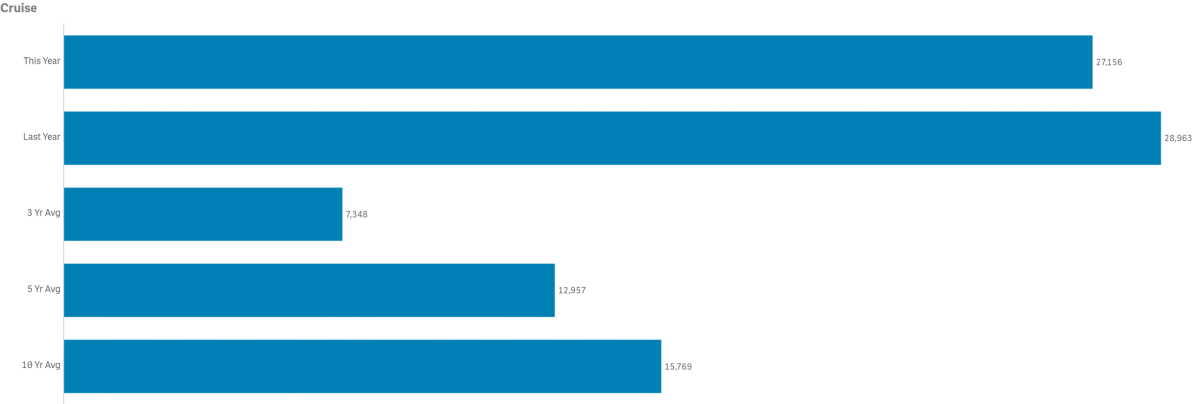
Cruise passenger counts totaled 27,156, down by 6.2% from 2022 or by 1,807 visitors
- 2009 had the highest Cruise Passenger volume for the month @ 35,062
- 2020 and 2021 had the lowest Cruise Passenger volume for the month @ 0
- June Cruise Passenger counts were above the three, five and ten-year averages by 45.2%, 73.7% and 41.2% respectively. Note multi-year averages are greatly impacted by the lack of cruise ships calling during COVID-19’s suspension of operations
- Cruise Passengers made up 23.88% of total monthly arrivals
- The number of Cruise Ships calling on Avalon was 7
- 2022 had the highest number of ships calling @ 9
- 2020 and 2021 had 0 ships call on us
- June typically has 8 ships call on us
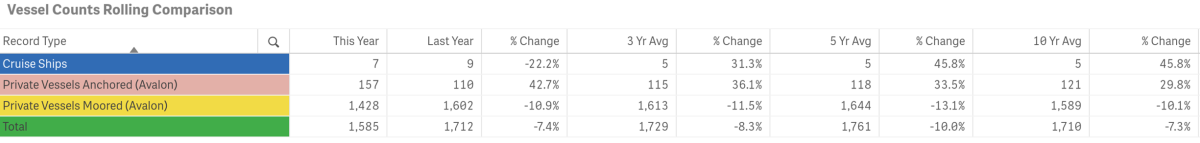
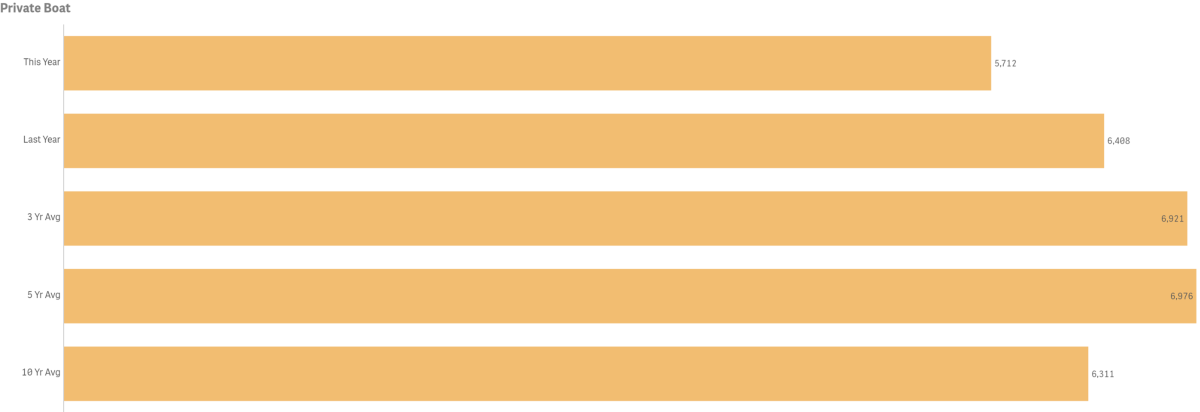
Private Boater Passenger counts totaled 5,712, down from last year by 10% or 696 visitors
- 2017 had the highest passenger volume for the month @ 7,258
- 2015 had the lowest passenger volume month @ 5,140
- June Private Boater Passenger counts were below the three and five-year averages by 11.5% and 13.1% respectively, but above the ten-year average by 10.2%
- Private Boaters Made up 5.02% of total monthly arrivals
- June’s number of Vessels Anchored was up by 42.7% @ 157 vs 110 last year
- 2018 had the highest number of Vessels Anchored @ 207
- 2012 had the lowest number of Vessels Anchored @ 3
- April was above the three, five and ten-year averages by 24.3%, 32.3% and 52.2% respectively
- June’s number of Vessels on Moorings was down 10% from last year @ 1, v428 vs. 1,602
- 2017 had the highest number of Vessels on Moorings @ 1,814
- 2015 had the lowest number of Vessels on Moorings @ 1,285
- June was below the three, five and ten-year averages by 11.5%, 13.1% and 10.1% respectively
Arrivals by Air
Combined in-bound air passenger counts for June totaled 2,689 down 29.7% from 3,824 in 2022 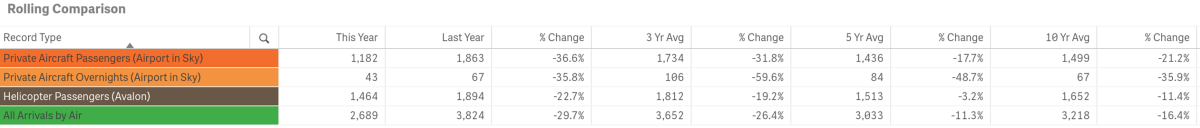
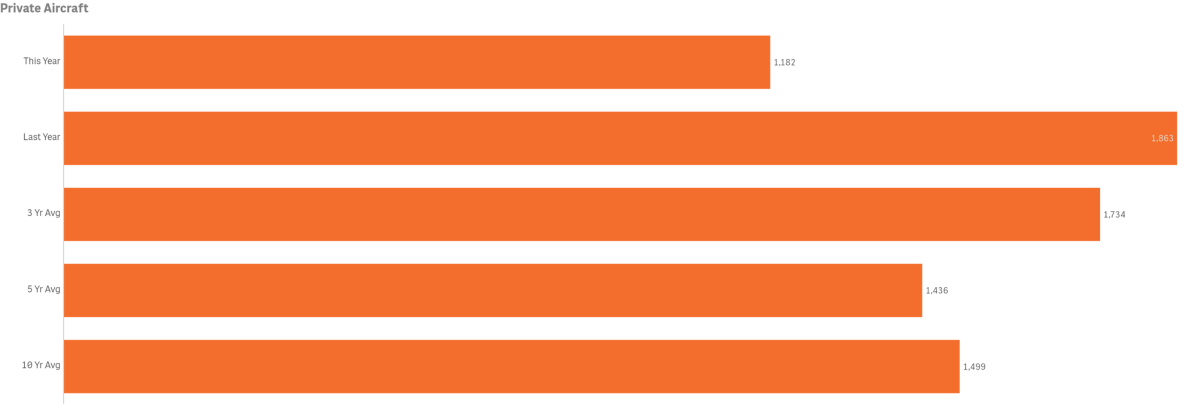
Private Aircraft Passengers (Airport in the Sky) were down 36.6% @ 1,182 vs 1,863 last year
- June’s Private Aircraft Passenger count was below the three, five and ten-year averages by 31.8%, 17.7% and 21.2% respectively
- June’s Private Aircraft Passengers made up 1.04% of total monthly arrivals
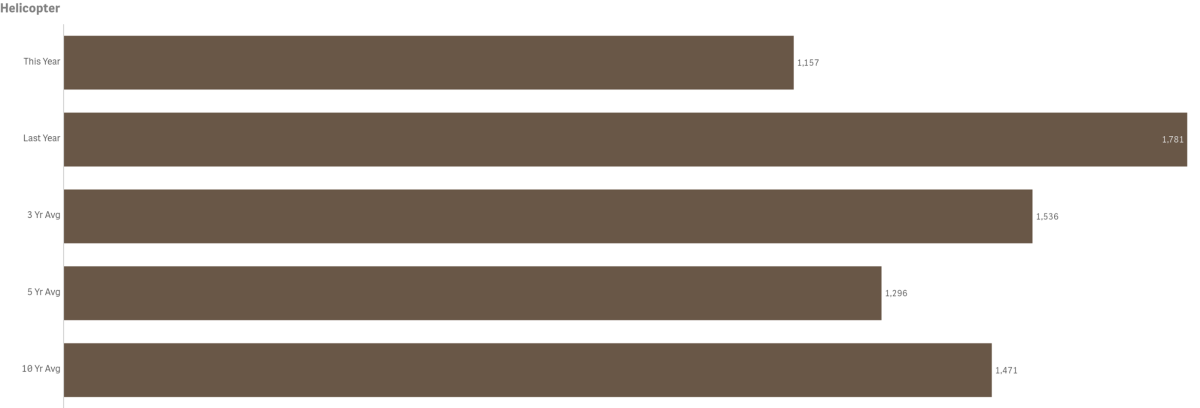
Helicopter Passenger counts were down year-over-year by 22.7% @ 1,464 vs. 1,894
- 2021 had the highest volume for the month @ 2,078
- 2020 the lowest volume for the month @ 613
- June Helicopter Passenger counts were below the three, five and ten-year averages by 19.2%, 3.2% and 11.4% respectively
- June Helicopter Passengers made up 1.29% of total monthly arrivals
Lodging
Hotel and Short-Term Rental Occupancy from Smith Travel and AIRDNA

- Hotel Occupancy for June was down by 9.7% @ 70.5% vs. 78.1% in 2022
- Hotel Occupancy was below three, five and ten-year averages by 6.4%, 1.6% and 4.8% respectively
- Short-Term Rental Occupancy for June was down 1.4% @ 69% vs 70% in 2022
- Short-term rental occupancy was below the three-year average by 2.8%, but above the five and ten-year averages by 21.7% and 28.2% respectively
- Among our competitive set, Hotels ranked 7th in Occupancy and 5th in Short-Term Rental Occupancy (high to low)
Competing Destination Occupancies

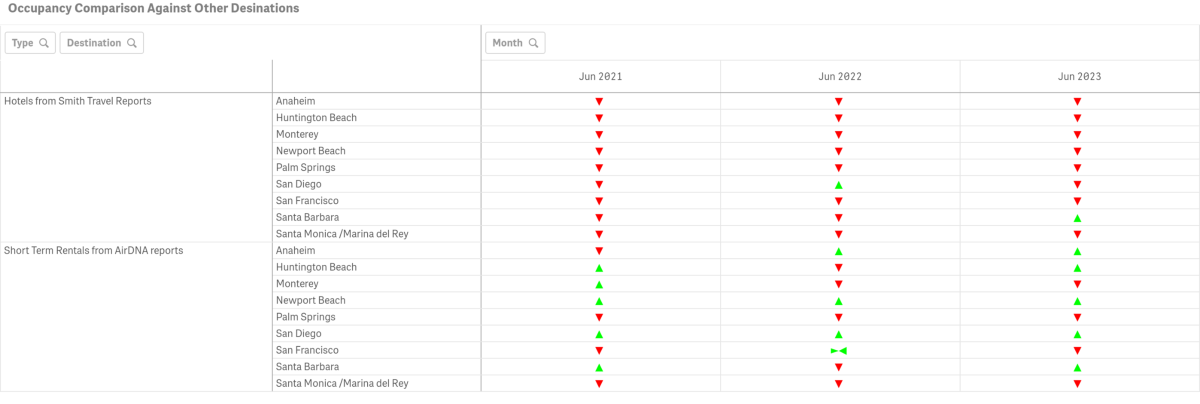
- June Hotel Occupancy was lower than Catalina’s in all competing destinations but Santa Barbara
- June Short-Term Rental Occupancy was higher than Catalina’s in Anaheim, Huntington Beach, Newport Beach, San Diego and Santa Barbara
Hotel and Short-Term Rental Average Daily Rate from Smith Travel and AIRDNA

- Among our competitive set, Catalina ranked 6th in Average Daily Rate for Hotels and 2nd for STRs (high to low)
- June Hotel Average Daily Rate was down .5% @ $254.80 vs. $256.20 in 2022
- June Short-Term Rental Average Daily Rate was up by 4.9% @ $615.00 vs. $586.00 in 2022
Hotel and Short-Term Rental Revenue Per Available Room from Smith Travel and AIRDNA

- Among our competitive set, Catalina ranked 3rd for hotels and 2nd for STRs in Revenue Per Available Room (high to low)
- June Hotel Revenue Per Available Room was down 10.2% @ $179.68 vs. $200.02 in 2022
- June Short-Term Rental Revenue Per Available Room was $425.00, up 3.2% from $412.00 in 2022
Visitors Services
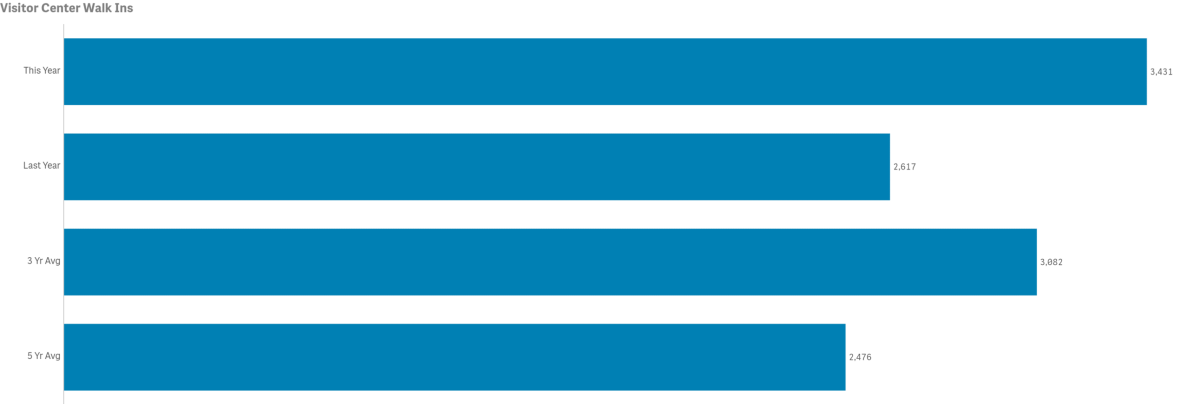
Catalina Island Visitor Center

- Walk-ins for the month were up year-over-year by 31.1% @ 3,431 vs. 2,617 in 2022
- 2018 has the highest volume for the month @ 8,597
- 2020 had the lowest volume for the month @ 93
- June walk-in counts were above the three and five-year averages by 11.3% and 38.6% respectively
- The number of Phone Calls for the month was down by 12.3% year-over-year @ 749 vs 854
- 2008 had the highest volume of calls for the month @ 2,318
- 2016 had the lowest volume of calls for the month @ 314
- June calls were below the three, five and ten-year averages by 19.1%, 21.4% and 33.3% respectively

LoveCatalina.com

- June LoveCatalina.com total website traffic was down year-over-year by 7.7% @ 96,689 vs 104,804 in 2022
- April total website users were below the three and five-year averages by 13.3% and 12.3% but above the ten-year average by 75.4%
- Book Direct referrals were down year-over-year by 26.1% @ 14,127 vs. 19,118 in 2022
- Book Direct lodging searches were down 8.5% @ 17,369 vs.18,988 in 2022
Note changes to Book Direct in 2021 resulted in shifting traffic between referrals and searches
Visitor Guides & Newsletters
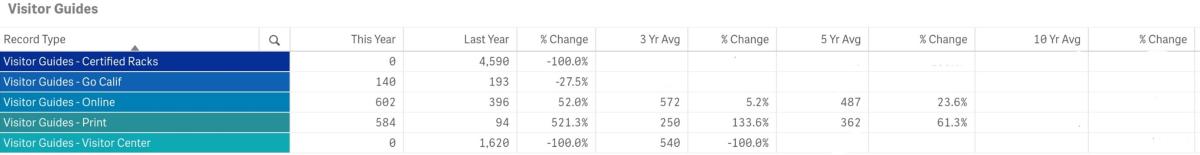
Note measures now include additional source tracking for months and years in which distributions were made
- No Guides were delivered to Certified Racks during the month
- Go California Print Guide orders totaled 140, down from 193 in 2022
- Online Guide downloads were up @ 602 vs. 396 in 2022
- Printed Visitor Guide orders on LoveCatalina.com @ 584, were up from 94 last year
- No Guides were delivered to the Visitor Center
Note, no 2021 Guide was printed and 2022 guide distribution initiated in late February 2022, resulting in more online guide orders
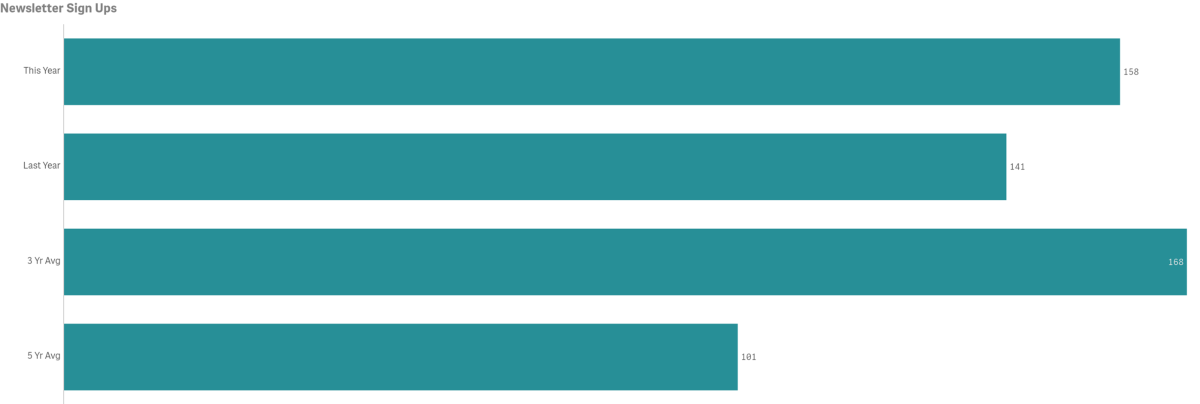
- New E-newsletter subscribers in June were up year-over-year @ 158 vs 141 in 2022
- New subscribers for the month were below the three-year average of 160 but above the five-year average of 101
Social Media
Cumulative totals by platform as of June below
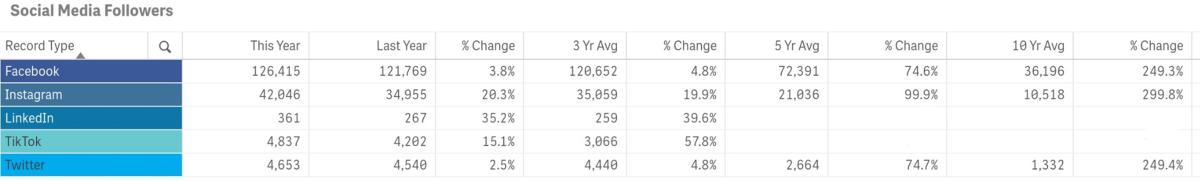
- Facebook followers are up year-over-year by 3.8%
- Instagram followers are up year-over-year by 20.3%
- Twitter followers are up year-over-year by 2.5%
- LinkedIn followers are up year-over-year by 35.2%
- TikTok is up year-over-year by 15.1%
Year-to-date—Historical Arrivals
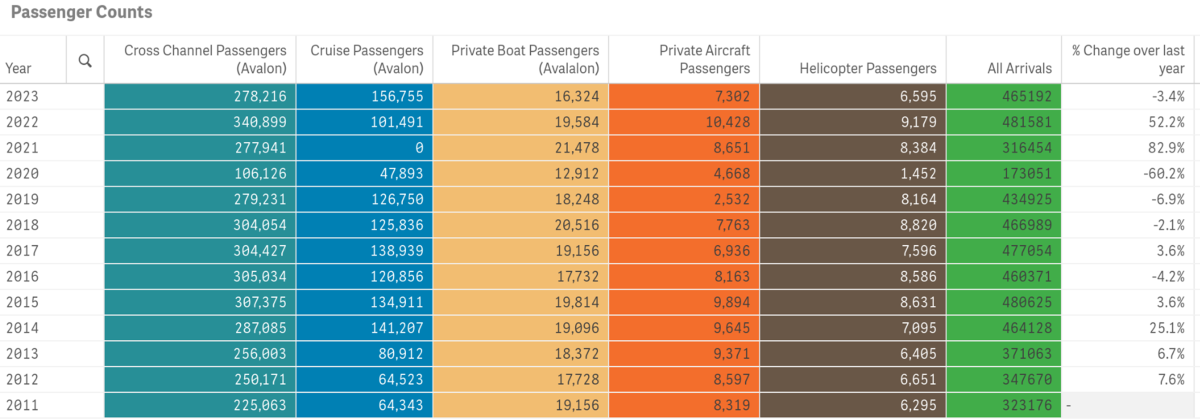
COVID-19 and pre-Covid-19 comparrison data is illustrated in the snapshot above (January – June)
Below is a graph of year-to-date and mutli-year comparissons of all arrivals by sector
- 2023 had the highest total visitation year-to-date @ 481,581, a difference of 16,389 visitors vs 2023
- 2020 had the lowest year-to-date total visitation @ 173,051
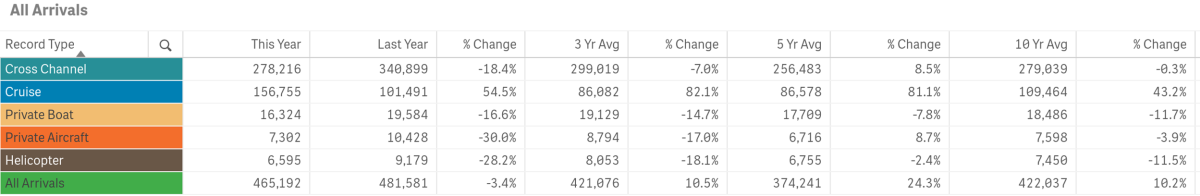
Fiscal Year-end Arrivals
Total Arrivals for the Fiscal Year that ended June 30, 2023 was 1,078,154, up by 10.2% from prior year @ 978,178
To view historical data for total arrivals by sector, year and month in a spreadsheet form click here.
Year-to-date Lodging
Hotel and Short-Term Rental Occupancy from Smith Travel and AirDNA

- Hotel Occupancy January through June 2023 was 4.6% @ 63.7% vs. 66.8% tracked for the same time period in 2022
- Short-Term Rental Occupancy was 54.2%, down from 57.2% in 2022
- According to Smith Travel, Catalina’s average YTD Hotel Occupancy of 63.7% was below the YTD occupancy for all of our competing destinations except for Monterey
- According to AirDNA, Catalina’s average Short-Term Rental YTD Occupancy of 54.2% was below all destinations in our competitive set
Year-to-date Visitor Services
Catalina Island Visitor Center

- The number of Phone Calls year-to-date are down by 17.1% @ 3,180 vs. 3,834 in 2022
- Year-to-date Phone Calls were below the three and five and-year averages by 8.9%, 13.2% and 34.5% respectively
- Number of Walk-Ins year-to-date are up @ 12,723 vs. 10,428 or 22%
- Year-to-date Walk-In counts were above the three and five-year averages by 21.6% and 34.9% respectively
Year-to-date LoveCatalina.com
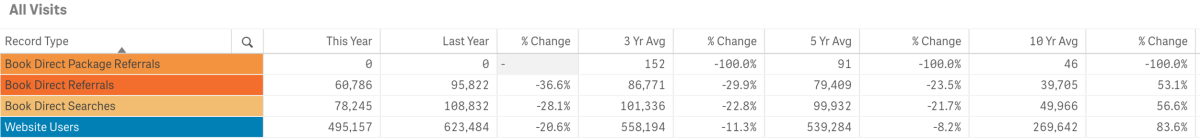
- LoveCatalina.com website users were down year-to-date by 20.6% @ 495,157 vs.623,484 in 2022
- Book Direct lodging searches were down by 28.1% @ 78,245 vs. 108,832 in 2022
- Book Direct referrals were down by 36.6% @ 60,786 vs. 95,822 in 2022
- Book Direct Package referrals were not active on our site
Note changes to Book Direct on member links has resulted in shifting some traffic to referrals vs. searches
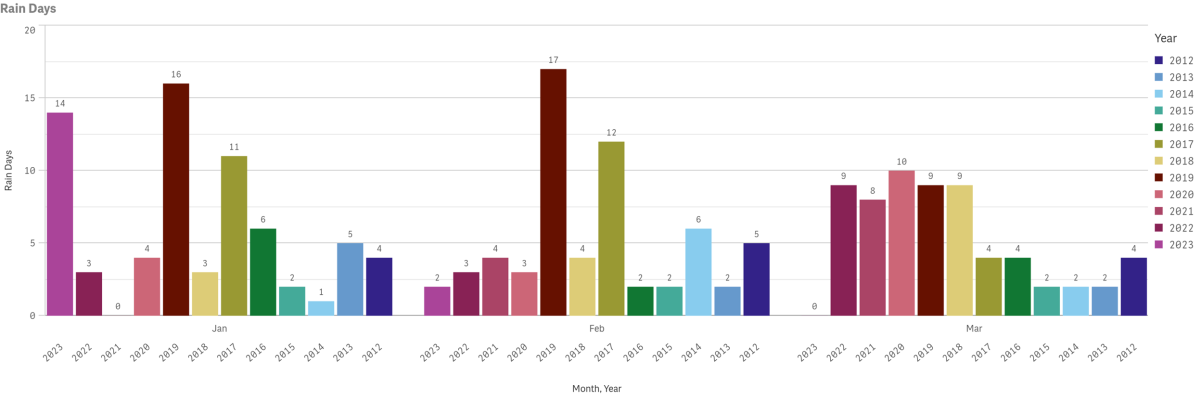
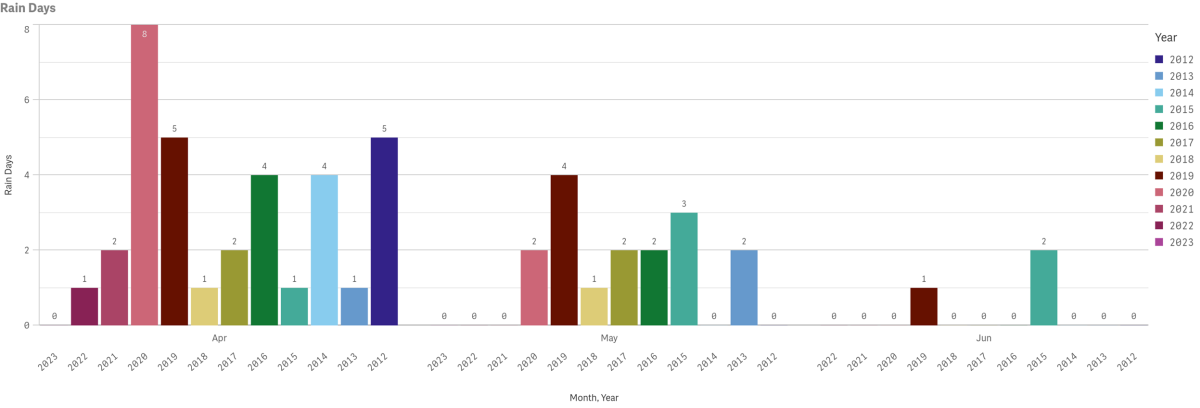
Weather
Data for recent highs, lows and precipitation are not currently available due to broken feed from the Harbor weather station. Multi-year rain days data is also displayed by year and month since 2012, likewise excluding recent months of this year. Measures are taken at Avalon Harbor.


Catalina Flyer from Newport
$10 Off Catalina Island Ferry
Hop onboard the Catalina Flyer for daily ferry service from Newport Beach to Avalon, Catalina Island in just over 1 hour.

Catalina Sea Spa
Recharge with massages starting at $110.
Discover Bliss at Catalina Sea Spa! Book online or call 310-510-8920. Treat yourself and escape to relaxation today!

