February 2023
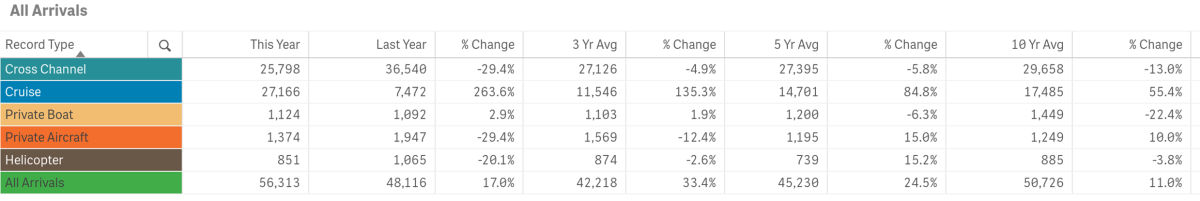
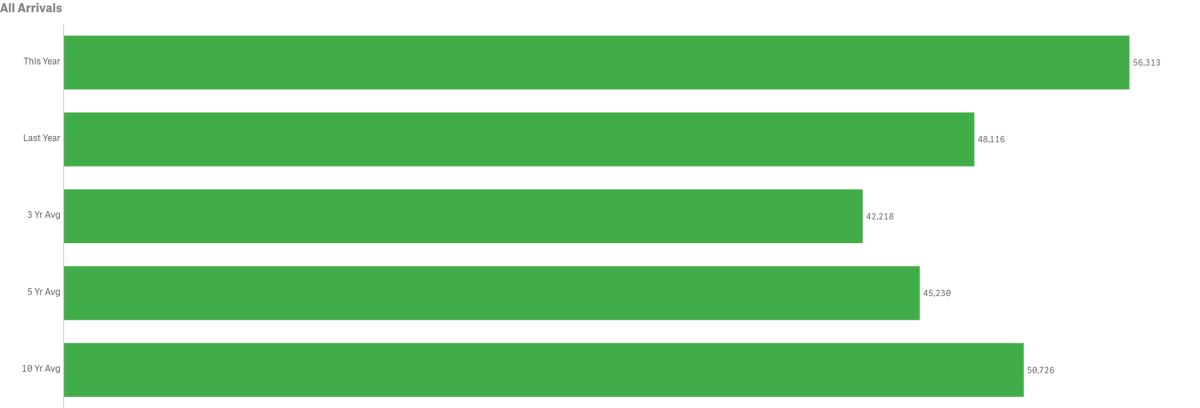
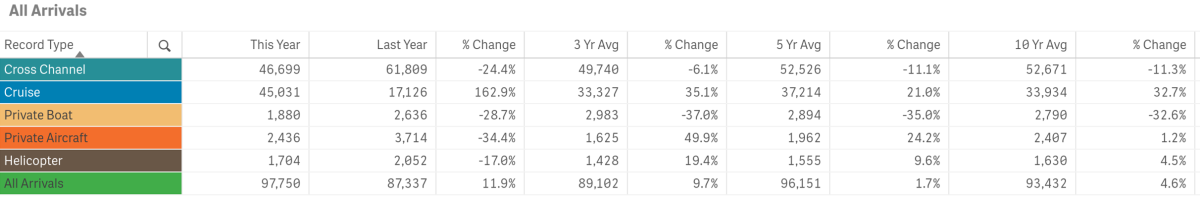
All Arrivals
February visitation increased year-over-year by 17.0% or 8,197 visitors
Previous tracking (below) for the month of February offers a comparison with and without COVID-19 impacts. February 2023 was below the peak visitation for the month recorded in 2015 of 59,557 by 3,244 travelers.

February’s total in-bound passenger count was above the three, five and ten-year averages for the month
Arrivals by Sea
Passengers arriving by sea, totaled 54,088 for the month, an increase of 19.9% from last year.

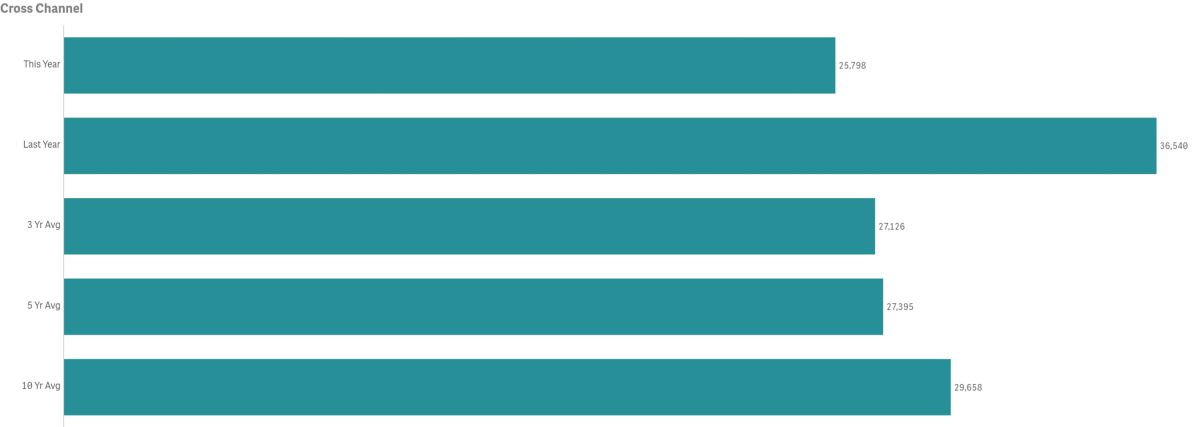
Cross Channel Passenger counts were down year-over-year by 29.4% or a decrease of 8,984 people
- 2016 had the highest volume for the month @ 39,162 passengers
- 1998 had the lowest volume for the month @ 15,517
- February Cross Channel Passenger counts were below the three, five and ten-year averages by 4.9%, 5.8% and 13.9% respectively
- Cross Channel Passengers made up 45.81% of total monthly arrivals
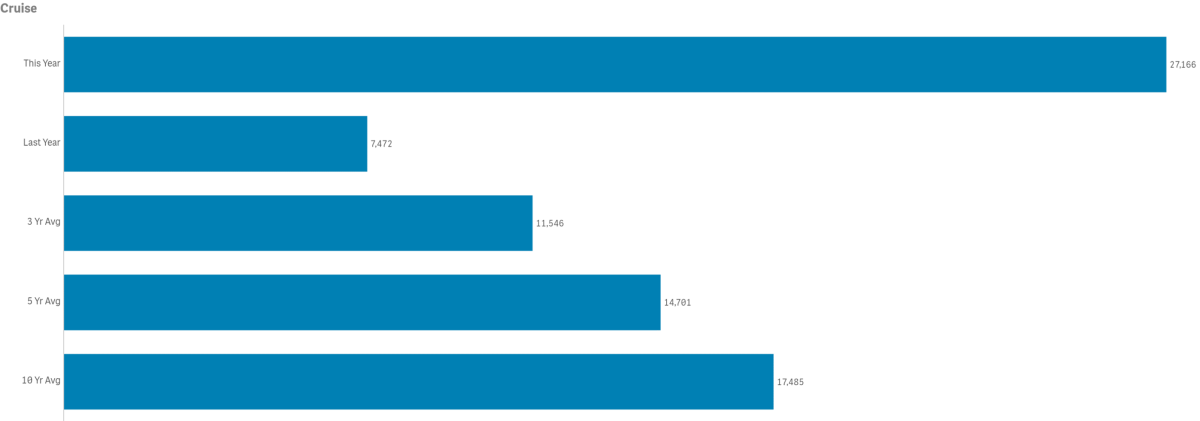
Cruise passenger counts totaled 27,166
- There were 27,166 cruise passengers in February 2022
- 2023 had the highest Cruise Passenger volume for the month @ 27,166 exceeding the previous high of 22,927 set in 2007
- 2021 had the lowest Cruise Passenger volume for the month @ 0. 1995 was next lowest at 4,117
- February Cruise Passenger counts were above the three, five and ten-year averages by 135.3%, 84.8% and 55.4% respectively. Note multi-year averages are greatly impacted by the lack of cruise ships calling during COVID-19 suspension of operations
- Cruise Passengers made up 48.24% of total monthly arrivals
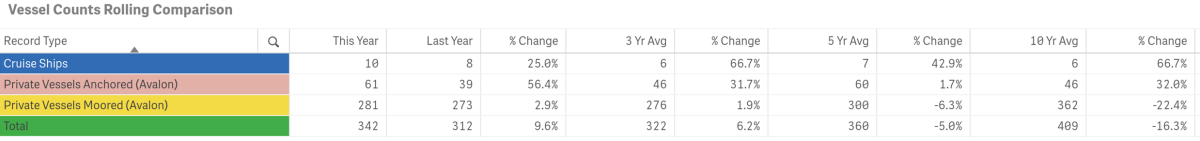
- The number of Cruise Ships calling on Avalon was 10
- 2023 had the highest number of ships calling @ 10
- 2021 had 0 ships call on us
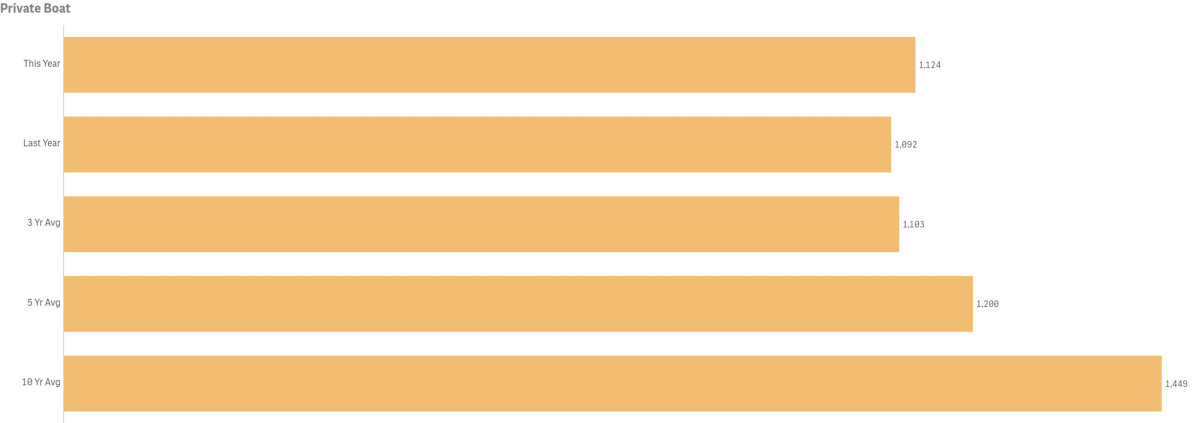
Private Boater Passenger counts totaled1,124
- Private Boater Passenger counts were up from last year by 2.9% @ 1,124 vs 1,092
- 2016 had the highest passenger volume for the month @ 2,236
- 2017 had the lowest passenger volume month @ 628
- February Private Boater Passenger counts were above the three-year average by 1.9%, but below the, five and ten-year averages by 6.3% and 22.4% respectively
- Private Boaters Made up 1.99% of total monthly arrivals
- February’s number of Vessels Anchored was up 56.4% @ 61 vs 39 last year
- 2016 had the highest number of Vessels Anchored @ 104
- 2013 had the lowest number of Vessels Anchored @ 2
- February was above the three, five and ten-year averages by 31.7%, 1.7% and 32.0% respectively
- February’s number of Vessels on Moorings was up 2.9% from last year @ 281 vs 273
- 2016 had the highest number of Vessels on Moorings @ 559
- 2017 had the lowest number of Vessels on Moorings @ 157
- February was above the three-year average by 1.9% but below the five and ten-year averages by6.3% and 22.4% respectively
Arrivals by Air
Combined in-bound air passenger counts for February totaled 2,235 down 26.8% from 3,052 in 2022 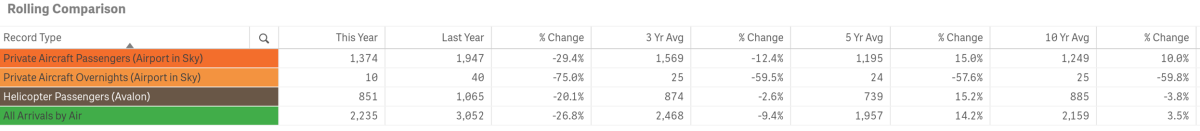
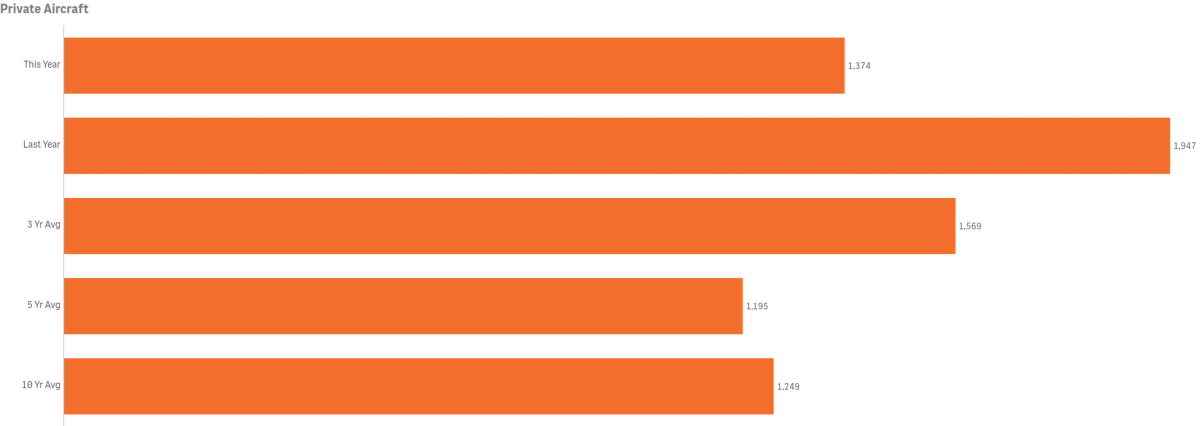
Private Aircraft Passengers (Airport in the Sky) were down 29.4% @ 1,374 vs 1,947 last year
- 2016 had the highest volume of Private Aircraft Passengers for the month @ 2,133
- 2019 had the lowest volume of Private Aircraft Passengers for the month @ 0
- February’s Private Aircraft Passenger count was below the three-year average by 12.4% but above the five and ten-year averages by 15.0% and 10.0% respectively
- February Private Aircraft Passengers made up 2.44% of total monthly arrivals
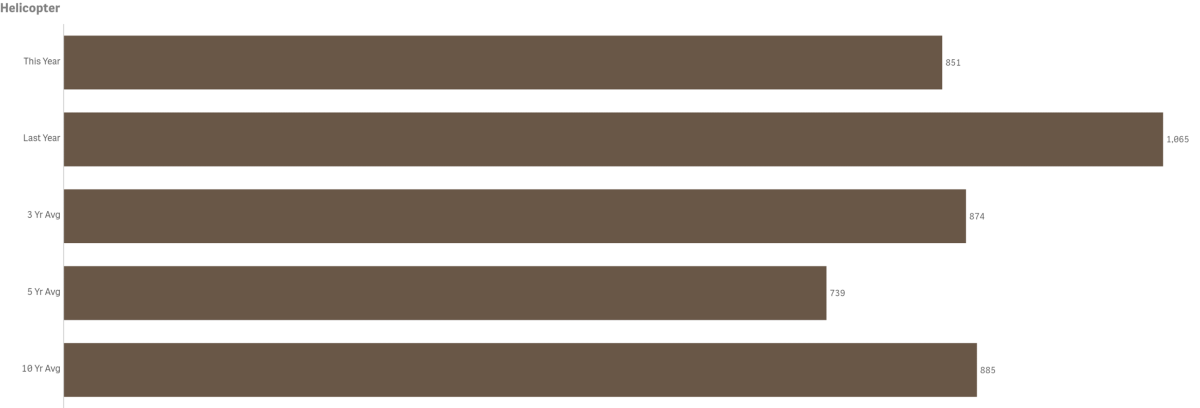
Helicopter Passenger counts were down year-over-year by 20.1% @ 851 vs. 1,065
- 2018 had the highest volume for the month @ 1,399
- 2020 the lowest volume for the month @ 0
- February Helicopter Passenger counts were below the three and ten-year averages by 2.6%, and 3.85% respectively but above the five-year average by 15.2%
- February Helicopter Passengers made up 1.51% of total monthly arrivals
Lodging
Hotel and Short-Term Rental Occupancy from Smith Travel and AIRDNA

- Hotel Occupancy for February was down by 11.9% @ 60.0% vs. 68.1% in 2022
- Hotel Occupancy was above the three-year average by 1.8% but below the five and ten-year average by 7.4% and 9.8% respectively
- Short-Term Rental Occupancy for February was down 3.3% @ 58.0% vs 60.0% in 2022
- Short-term rental occupancy was above the three, five and ten-year average by 6.6%,14.2% and 30.5% respectively
Competing Destination Occupancie
- Among our competitive set, Catalina ranked 9th in Hotel Occupancy and 9th in STR Occupancy for February 2023 (high to low)

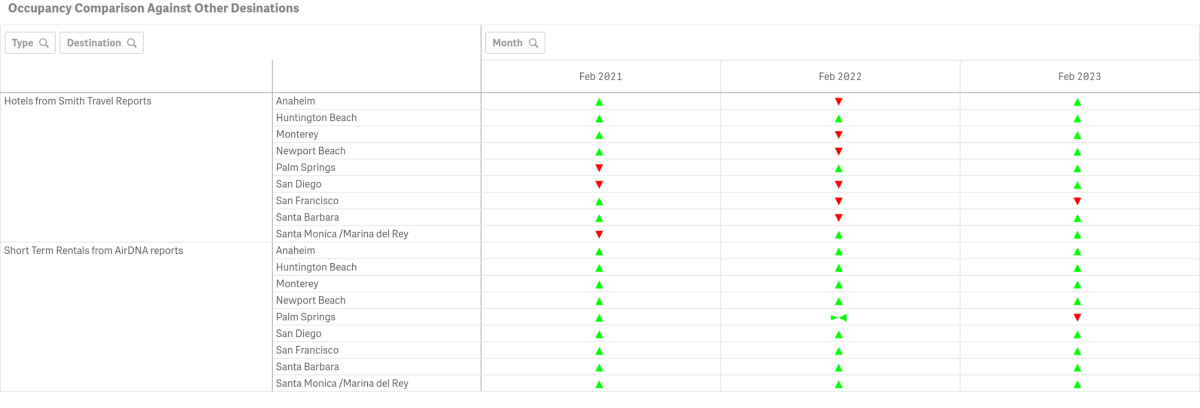
- February Hotel Occupancy was greater than Catalina’s in all but San Francisco
- February Short-Term Rental Occupancy was greater than Catalina’s all but Palm Springs
- Among our competitive set, Catalina ranked 9th in Occupancy for Hotels and 10th for STRs (high to low)
Hotel and Short-Term Rental Average Daily Rate from Smith Travel and AIRDNA

- Among our competitive set, Catalina ranked 5th in Average Daily Rate for Hotels and 4th for STRs (high to low)
- February Hotel Average Daily Rate was down 1.4% @ $210.88 vs. $213.86 in 2022
- February Short-Term Rental Average Daily Rate was up by 3.4% @ $577.00 vs. $558.00 in 2022
Hotel and Short-Term Rental Revenue Per Available Room from Smith Travel and AIRDNA

- Among our competitive set, Catalina ranked 6th for hotels and 10th for STRs in Revenue Per Available Room (high to low)
- February Hotel Revenue Per Available Room was up 17.0% @ $120.69 vs. $103.15 in 2022
- February Short-Term Rental Revenue Per Available Room was $265.00, down .7% from $267.00 in 2022
Visitors Services
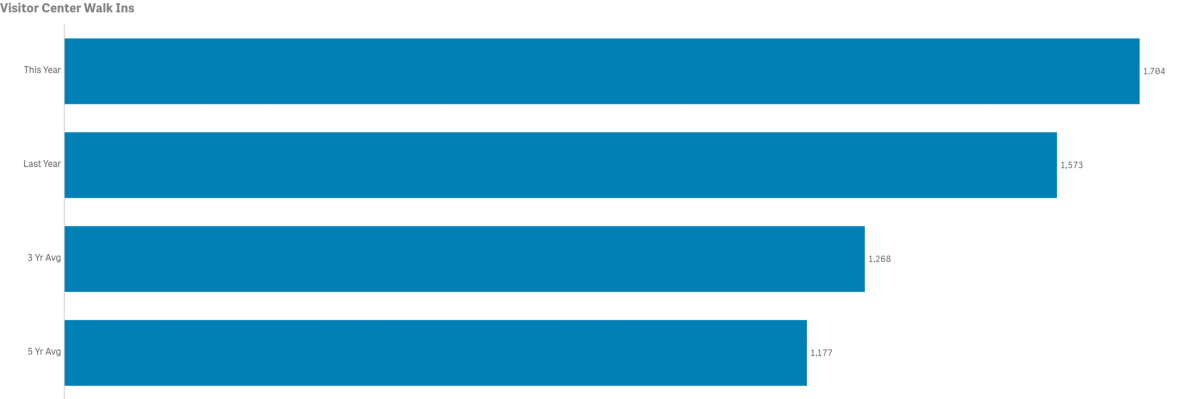
Catalina Island Visitor Center

- Walk-ins for the month were up year-over-year by 8.3% @ 1,704 vs. 1,573 in 2022
- 2023 has the highest volume for the month
- 2021 had the lowest volume for the month @ 528
- February walk-in counts were above the three and five-year averages by 34.3% and 44.8% respectively
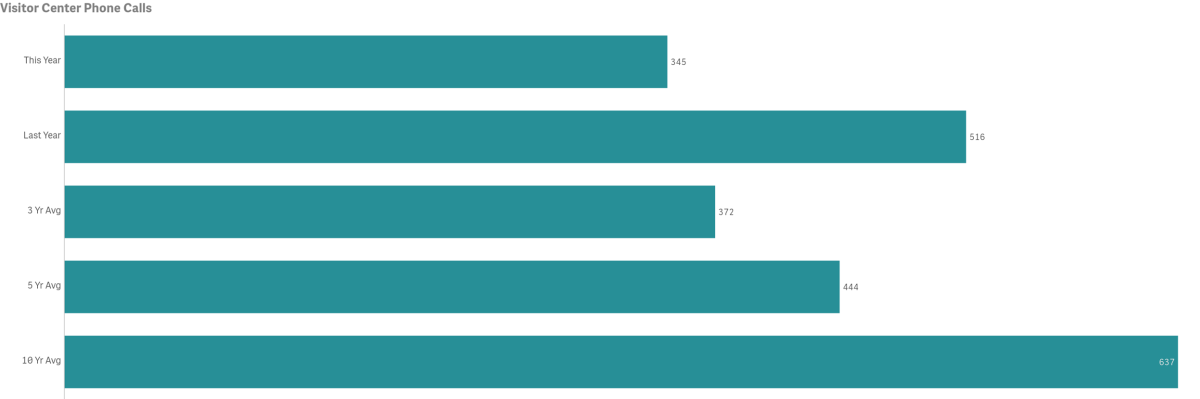
- The number of Phone Calls for the month was down by 33.1% year-over-year @ 345 vs 516 in 2022
- 2007 had the highest volume of calls for the month @ 1,265
- 2021 had the lowest volume of calls for the month @ 256
- February calls were below the three, five and ten-year averages by 7.3%, 22.2% and 45.9% respectively
LoveCatalina.com
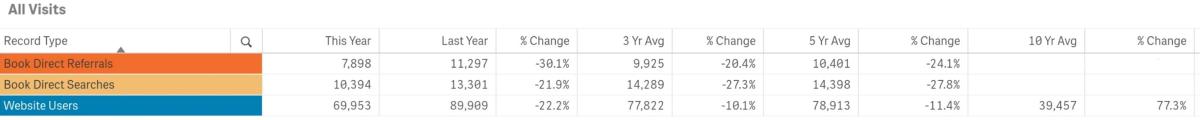
- February LoveCatalina.com total website users was down year-over-year by 22.2% @ 69,953 vs 89,909 in 2022
- February total website users were below the three and five-year averages by 10.1% and 11.4% but above the ten-year average by 77.3%
- Book Direct referrals were down year-over-year by 30.1% @ 7,898 vs. 11,297 in 2022
- Book Direct lodging searches were down 21.9% @ 10,394 vs. 13,301 in 2022
Note changes to Book Direct in 2021 resulted in shifting traffic between referrals and searches
Visitor Guides & Newsletters
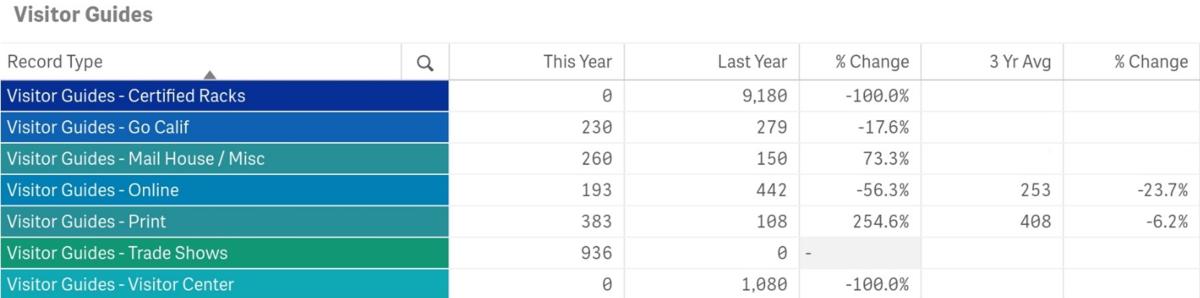
- Go California Print Guide orders totaled 230, down from 279 in 2022
- 260 Guides were delivered via Mail House for the month, up from 150 in 2022
- Online Guide downloads were down @ 193 vs. 442 in 2022
- Printed Visitor Guide orders on LoveCatalina.com @ 383, were up from 108 last year
- No Guides were delivered to the Visitor Center or Certified Racks during the month but were distributed from inventory on hand
Note, no 2021 Guide was printed and 2022 guide distribution initiated in late February 2022, resulting in more online guide orders
Some distributors tracking is running behind and will be updated as received
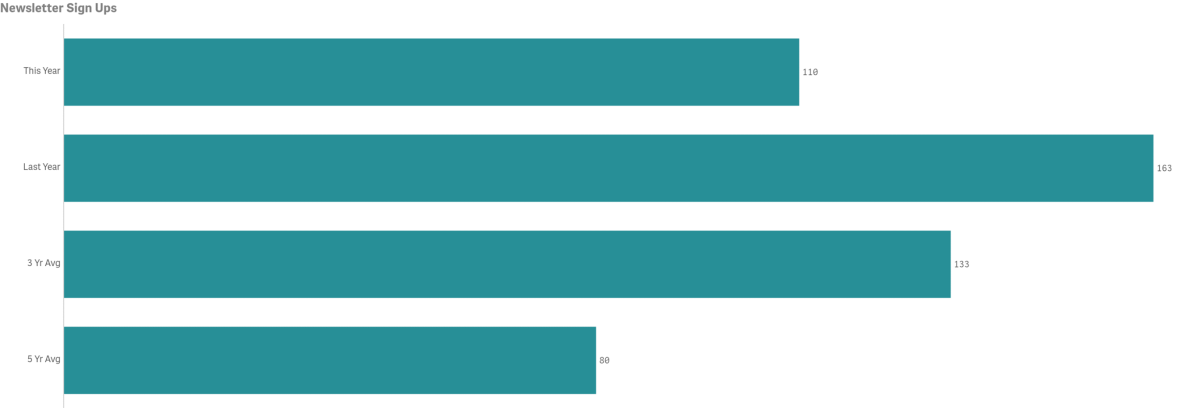
- New E-newsletter subscribers in February were down year-over-year @ 110 vs 163 in 2022
- New subscribers for the month were below the three-year average of 133 but above the five-year average of 80
Social Media
Cumulative totals by platform as of February below

- Facebook followers are up year-over-year by 4.0%
- Instagram followers are up year-over-year by 23.9%
- Twitter followers are up year-over-year by 5.2%
- LinkedIn followers are up year-over-year by 40.3%
- TikTok is our newest platform and is up year-over-year by 557.8%.
Year-to-date—Historical Arrivals
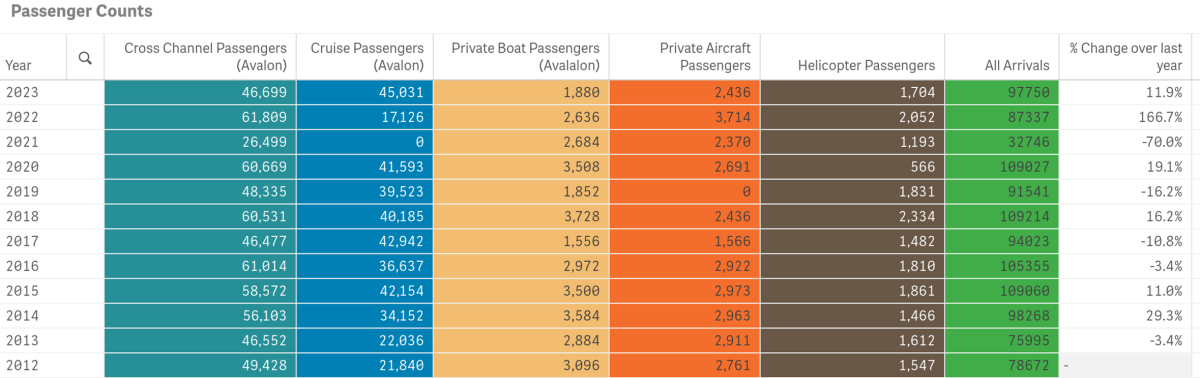
COVID-19 and pre-Covid-19 comparrison data is illustrated in the ten-year plus snapshot above (January – February combined)
- 2018 had the highest total visitation year-to-date @ 109,214, a difference of 11,464 visitors in 2023
- 2021 had the lowest year-to-date total visitation @ 32,746
To view historical data for total arrivals by sector, year and month in a spreadsheet form click here.
Year-to-date Lodging
Hotel and Short-Term Rental Occupancy from Smith Travel and AirDNA,

- Hotel Occupancy January through February 2023 was 56.7% vs. 55.7% tracked for the same time period in 2022
- Short-Term Rental Occupancy was 46.5%, down from 48.5% in 2022
- According to Smith Travel, Catalina’s average YTD Hotel Occupancy of 56.7% was below the YTD occupancy for all of our competing destinations
- According to AirDNA, Catalina’s average Short-Term Rental YTD Occupancy was above Palm Springs, but below all other destinations in our competitive set
Year-to-date Visitor Services
Catalina Island Visitor Center

- The number of Phone Calls year-to-date are down by 21.2% @ 707 vs. 897 in 2022
- Year-to-date Phone Calls exceeded the three-year average, but are below the five and ten-year averages
- Number of Walk-Ins year-to-date are down @ 2,835 vs. 2,943 or 3.7%
- Year-to-date Walk-In counts were above the three and five-year averages
Year-to-date LoveCatalina.com
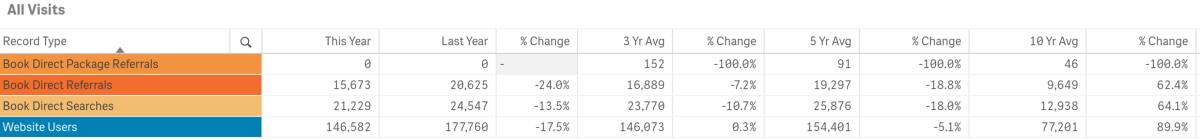
- LoveCatalina.com website users were down year-to-date by 17.5% @ 146,582 vs. 177,769 in 2022
- Book Direct lodging searches were down by 13.5% @ 21,229 vs. 24,547 in 2022
- Book Direct referrals were down by 24.0% @ 15,673 vs. 20,625 in 2022
- Book Direct Package referrals were not active on our site
Note changes to Book Direct on member links has resulted in shifting some traffic to referrals vs. searches
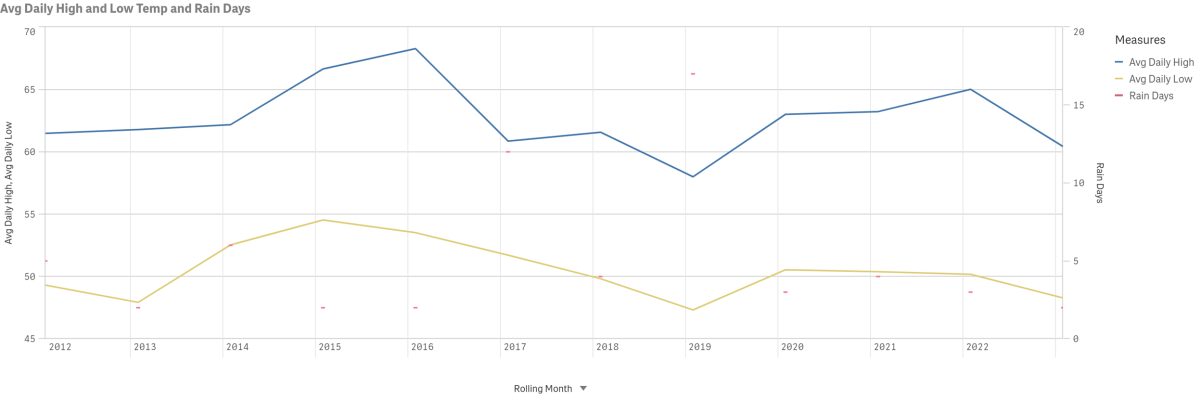
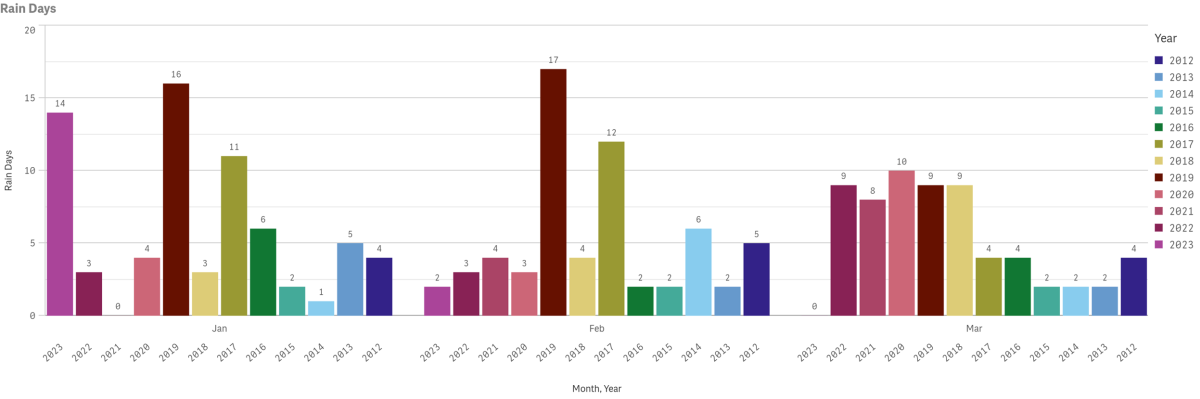
Weather
Data for February highs, lows and precipitation going back to 2012 is displayed below. Multi-year rain days data is also displayed by year and month since 2012. Measures are taken at Avalon Harbor.