
November 2022
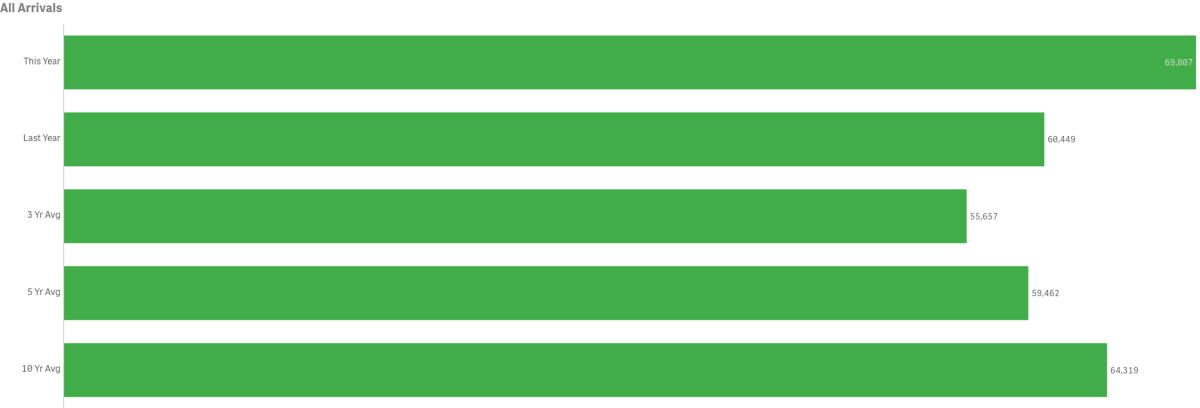
All Arrivals
November visitation increased year-over-year by 15.5% or 9,358 visitors
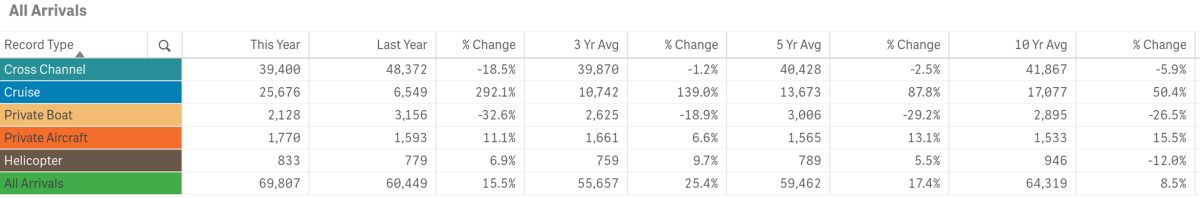
Previous tracking (below) for the month of November offers a comparison with and without COVID-19 impacts. November 2022’s total of 69,807 was slightly below 2019’s pre COVID-19 total monthly arrivals of 70,062 by 255 visitors. November 2022 was below the peak visitation for the month in 2017 of 76,132.
November’s total in-bound passenger count was above the three, five and ten-year averages.
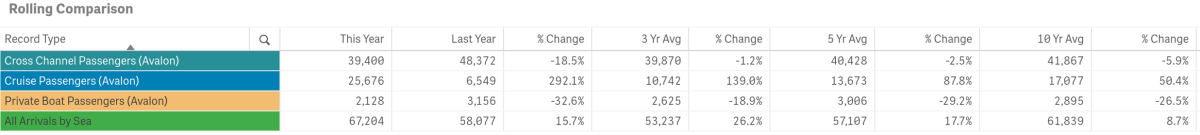
Arrivals by Sea
Passengers arriving by sea, totaled 67,204 for the month, an increase of 15.7% from last year.
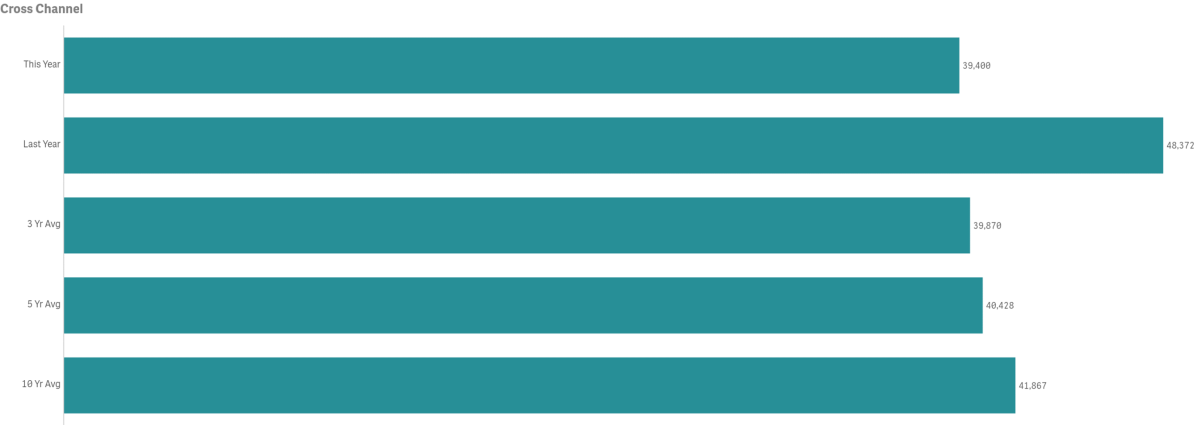
Cross Channel Passenger counts were down year-over-year by 18.5% or a decrease of 8,872 people
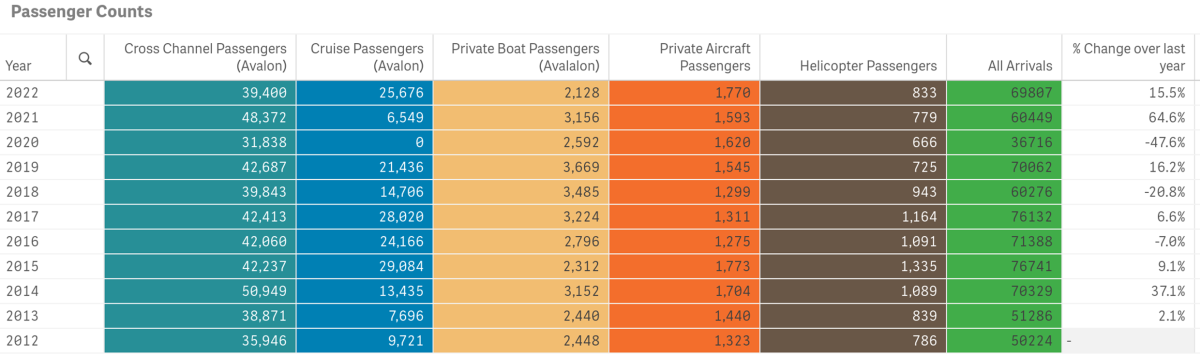
- 2014 had the highest volume for the month @ 50,949 passengers
- 2009 had the lowest volume for the month @ 24,262
- November Cross Channel Passenger counts were below the three, five and ten-year averages by 1.2%, 2.5% and 5.9% respectively
- Cross Channel Passengers made up 56.44% of total monthly arrivals
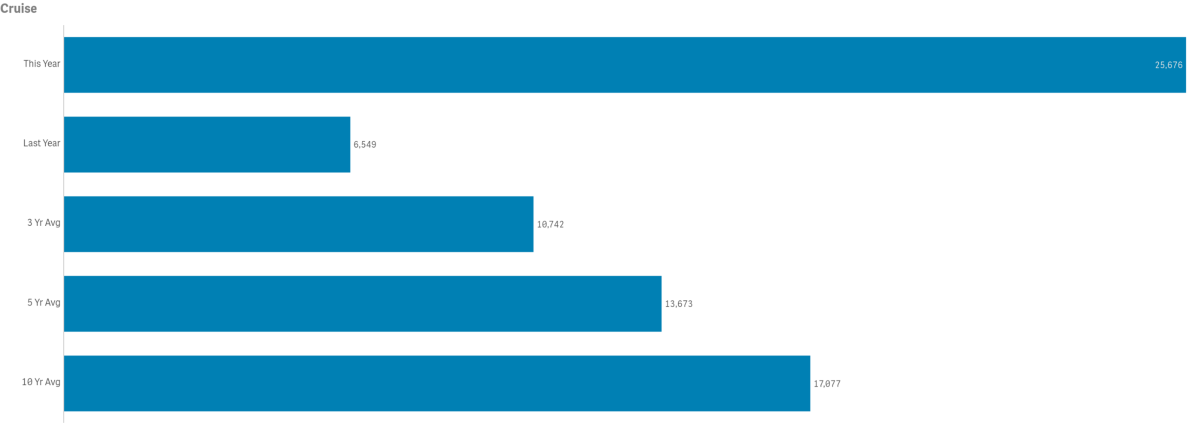
Cruise passenger counts totaled 25,676
- There were 6,549 cruise passengers in November 2021
- 2015 had the highest Cruise Passenger volume for the month @ 29,084
- 2020 had the lowest Cruise Passenger volume for the month @ 0. 2021 was next lowest at 6,549
- Pre-COVID-19 the lowest count for the month was 2011 @ 7,364
- November Cruise Passenger counts were above the three, five and ten-year averages by 139%, 87.8% and 50.4% respectively. Note multi-year averages are greatly impacted by the lack of cruise ships calling during COVID-19 suspension of operations
- Cruise Passengers made up 36.78% of total monthly arrivals
- The number of Cruise Ships calling on Avalon was 8
- 2016 and 2017 had the highest number of ships calling @ 11
- 2020 had 0 ships call on us and 2021 had 5
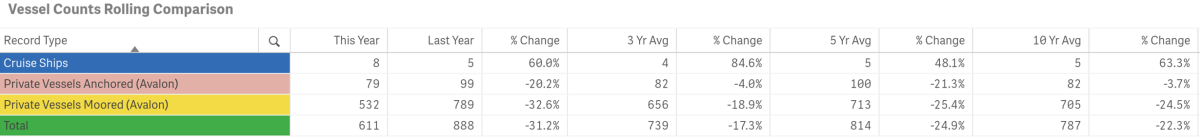
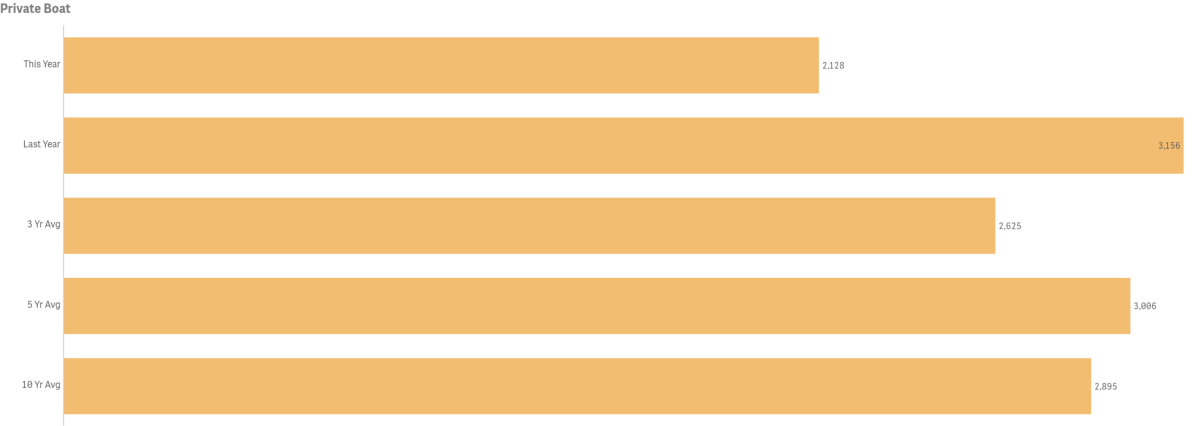
Private Boater Passenger counts were down from last year by 32.6% @ 2,128 vs. 3,156
- 2019 had the highest passenger volume for the month @ 3,669
- 2012 had the lowest passenger volume month @ 2,448
- November Private Boater Passenger counts were below the three and five and ten-year averages by 18.9%, 29.2% and 26.5% respectively
- Private Boaters Made up 3.05% of total monthly arrivals
- November’s number of Vessels Anchored was down 20.2% @ 79 vs 99 last year
- 2018 had the highest number of Vessels Anchored @ 171
- 2011 had the lowest number of Vessels Anchored @ 4
- November was below the three, five and ten-year averages by 4%, 21.3% and 3.7% respectively
- November’s number of Vessels on Moorings was down 32.6% from last year @ 532 vs 789
- 2019 had the highest number of Vessels on Moorings @ 856
- 2015 had the lowest number of Vessels on Moorings @ 578
- November was below the three and five and ten-year averages for Vessels on Moorings by 18.9%, 25.4% and 24.5% respectively
Arrivals by Air
Combined in-bound air passenger counts for November totaled 2,632, up 8.3% from 2,430 in 2021. 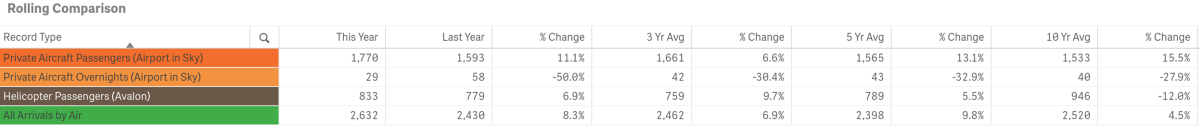
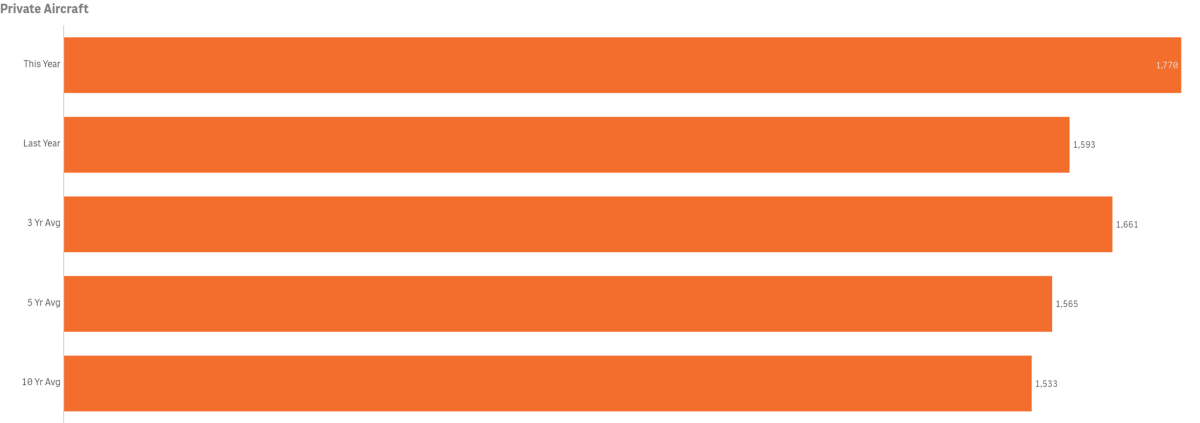
Private Aircraft Passengers (Airport in the Sky) were up 11.1% @ 1,770 vs 1,593 last year
- 2015 had the highest volume of Private Aircraft Passengers for the month @ 1,773
- 2007 had the lowest volume of Private Aircraft Passengers for the month @ 1,079
- November’s Private Aircraft Passenger count was above the three, five and ten-year averages by 6.6%, 13.1% and 15.5% respectively.
- November Private Aircraft Passengers made up 2.54% of total monthly arrivals
Helicopter Passenger counts were up year-over-year by 6.9% @ 833 vs. 779
- 2015 had the highest volume for the month @ 1,335
- 2011 the lowest volume for the month @ 623
- November Helicopter Passengers counts were above the three and five-year averages by 9.7% and 5.5% respectively, but below the ten-year average by 12%
- November Helicopter Passengers made up 1.19% of total monthly arrivals

Lodging
Hotel and Short-Term Rental Occupancy from Smith Travel and AIRDNA

- Hotel Occupancy for November was down by 0.8% @ 63.4% vs. 63.9% in 2021
- Hotel Occupancy was above the three-year average by 7.6%, but below the five and ten-year averages by 0.8% and 2.0% respectively
- Short-Term Rental Occupancy for November was down 22.0% @ 39% vs 50% in 2021
- Short-term rental occupancy was below the three-year average by 10.8%, but above the five and ten-year averages by 6.7% and 6.4% respectively
Competing Destination Occupancies
- Among our competitive set, Catalina ranked 6th in Hotel Occupancy and 10th in STR Occupancy for November 2022 (high to low)

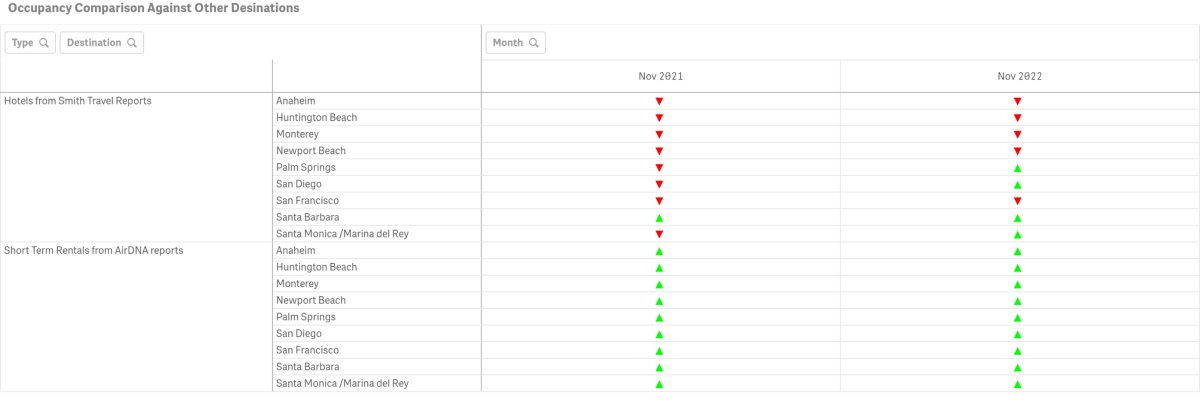
- November Hotel Occupancy was greater than Catalina’s in Palm Springs, San Diego, Santa Barbara and Santa Monica
- November Short-Term Rental Occupancy was greater than Catalina’s all competing markets
Hotel and Short-Term Rental Average Daily Rate from Smith Travel and AIRDNA

- Among our competitive set, Catalina ranked 9th in Average Daily Rate for Hotels and 5th in Average Daily Rate for STRs (high to low)
- November Hotel Average Daily Rate was up 2.6% @ $196.92 vs. $191.97 in 2021
- November Short-Term Rental Average Daily Rate was up down by 4.1% @ $519.00 vs. $541.00 in 2021
Hotel and Short-Term Rental Revenue Per Available Room from Smith Travel and AIRDNA

- Among our competitive set, Catalina ranked 10th for hotels and 10th for STRs in Revenue Per Available Room (high to low)
- November Hotel Revenue Per Available Room was up 1.7% @ $124.92 vs. $122.82 in 2021
- November Short-Term Rental Revenue Per Available Room was $203.00, down 24% from $268.00 in 2021
Visitors Services
Catalina Island Visitor Center

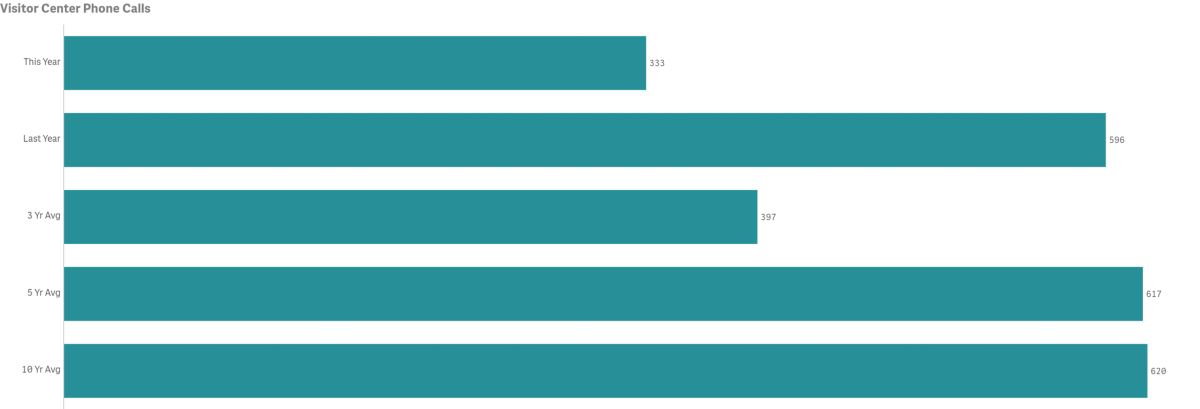
- Phone Calls for the month were down year-over-year by 44.1% @ 333 vs. 596 in 2021
- 2007 had the highest volume for the month @ 1,108 calls
- 2020 had the lowest volume for the month @ 261. Pre-COVID-19 2015 had the lowest volume for the month @ 464 calls
- November call counts were below the three, five and ten-year averages by 16.1%, 46.0% and 46.3% respectively
Note: phone sales for the annual New Year’s Eve Gala halted in 2019, resulting in lower call volumes July - December
- The number of Walk-Ins for the month was up by 6.8% year-over-year @ 2,257 vs 2,114 in 2021
- 2016 had the highest volume of Walk-ins for the month @ 3,241 guests
- 2020 had the lowest volume of Walk-ins for the month @ 676 guests
- November Walk-In counts were above the three and five-year averages by 34.2% and 9.0% respectively
LoveCatalina.com

- November LoveCatalina.com total website users was down year-over-year by 5.1% @ 58,774 vs. 61,936 in 2021
- Monthly the number of website users was above the three, five and ten-year averages by 8.5%, 19.9% and 139.8% respectively
- Book Direct referrals were down year-over-year by 35.0% @ 4,538 vs. 6,978 in 2021
- Book Direct lodging searches were down 17.2% @ 6,702 vs. 8,096 in 2021
Note changes to Book Direct in 2021 resulted in shifting traffic between referrals and searches
Visitor Guides & Newsletters

Note measures now include additional source tracking for months and years in which distributions were tracked.
- Printed Visitor Guide orders on LoveCatalina.com @ 254, were up from 32 last year
- Online Guide downloads were down @ 106 vs. 329 in 2021
- Go California Print Guide orders totaled did not report for the month
- Mail House Guide deliveries were not reported for the month
- No new Guides were delivered to the Visitor Center during the month
- Shipments of Guides to Certified racks totaled 18,360
Note, no 2021 Guide was printed and 2022 guide distribution initiated in late February 2022.
Some distributors tracking is running behind and will be updated as received.
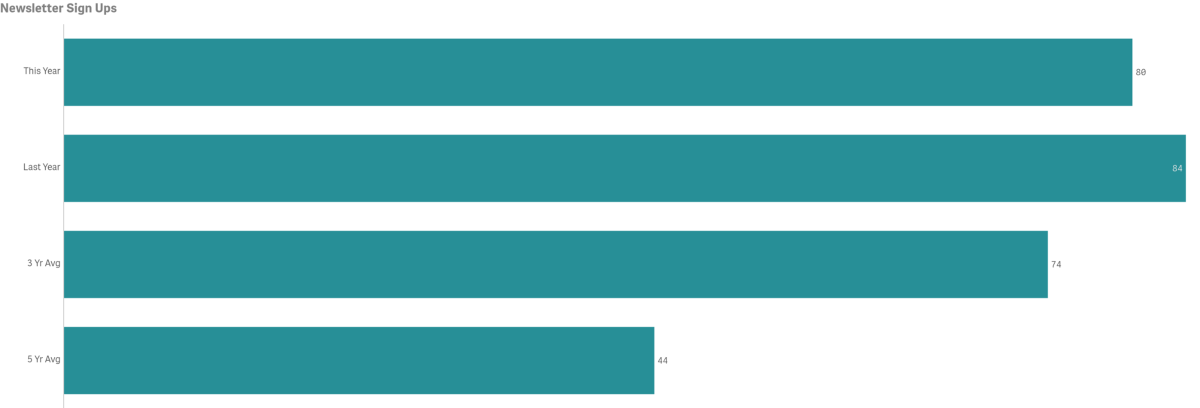
- New E-newsletter subscribers in November were down slightly year-over-year @ 80 vs 84 in 2021
- New subscribers were above the three and five-year averages of 74 and 44 respectively for the month
Social Media
Cumulative totals by platform as of November below
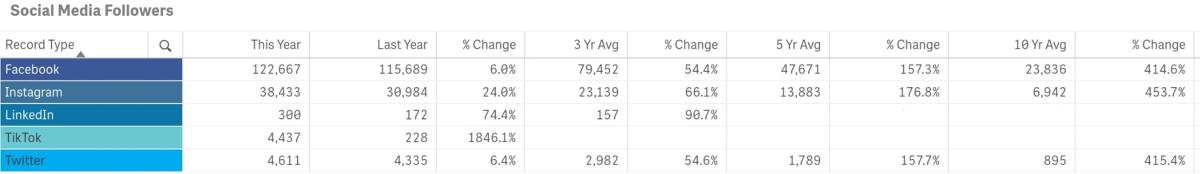
- book followers are up year-over-year by 6.0%
- Instagram followers are up year-over-year by 24.0%
- Twitter followers are up year-over-year by 6.4%
- LinkedIn followers are up year-over-year by 74.4%
- TikTok is our newest platform and is up year-over-year by 1,846.1%.
Year-to-Date Measures
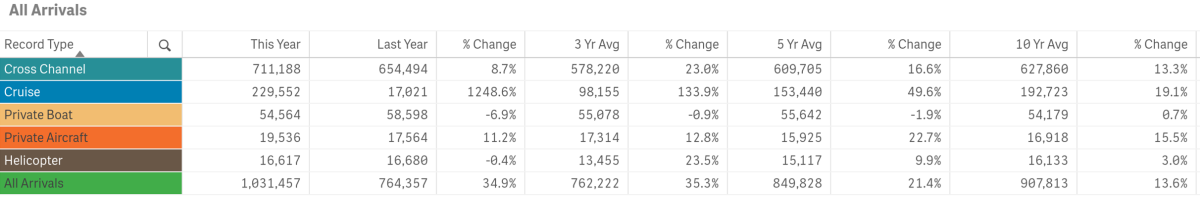
Total year-to-date arrivals are up from last year by 36.6%

- Year-to-date Total Arrivals were up @ 1,031,457 vs. 764,357 last year, a difference of 267,100 visitors or 55.7%
- The total arrivals year-to-date exceeded the three-year average of 762,222 by 35.3%, five-year average of 849,828 by 21.4% and ten-year average of 907,813 by 13.6%
- Arrival sectors are up year-to-date except for Private Boat and Helicopter
Year-to-Date—Historical Arrivals
COVID-19 and pre-Covid-19 comparison data is illustrated in the ten-year plus snapshot below (January - November combined).
- 2017 had the highest total visitation year-to-date @ 1,031,953
- 2020 had the lowest year-to-date total visitation @ 490,851
To view historical data for total arrivals by sector, year and month in a spreadsheet form click herePDF File.
Year-to-date Lodging
Hotel and Short-Term Rental Occupancy from Smith Travel and AIRDNA

- Hotel Occupancy YTD is 72.2% vs. 64.1% tracked for the same time period in 2021
- Short-Term Rental Occupancy Year-To-Date is 58.8%, equal to 2021
- According to Smith Travel, Year-To-Date Catalina’s average Hotel Occupancy of 72.2% was above Palm Springs, Huntington Beach, Newport Beach, Monterey and San Francisco. Competing destinations of San Diego, Santa Barbara, Anaheim and Santa Monica exceeded our year-to-date average Hotel Occupancy.
- According to AirDNA, Catalina’s average Year-To-Date Short-Term Rental Occupancy was above Palm Springs, but below all other destinations in our competitive set.
Note 2021 and 2022 rates have impacted occupancy on Catalina Island
Year-to-date Visitor Services
Catalina Island Visitor Center

- The number of Phone Calls year-to-date are down by 1.7% @ 7,267 vs. 7,395
- Year-to-date Phone Calls exceeded the three-year average, but are below the five and ten-year averages
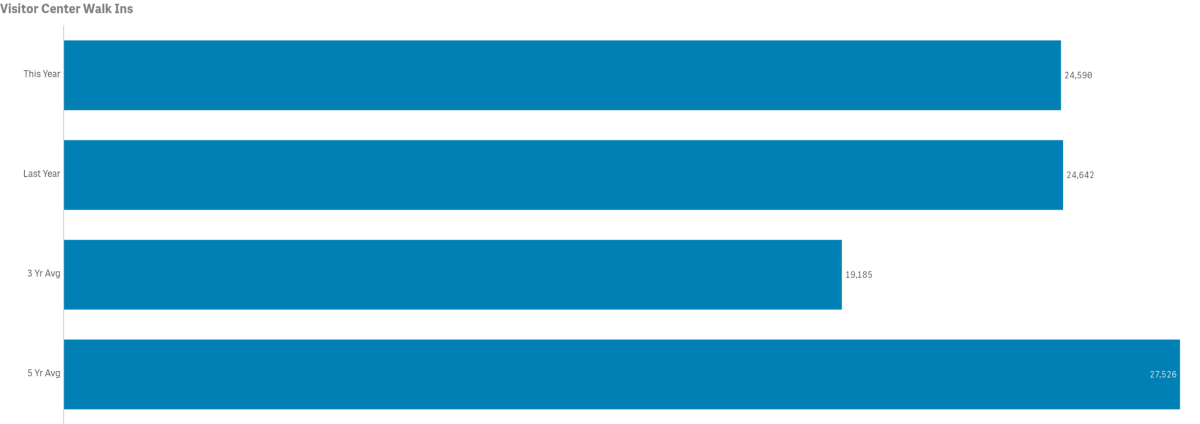
- Number of Walk-Ins year-to-date are up @ 24,590 vs. 23,039 or 6.7%
- Year-to-date Walk-In counts were above the three-year average, but below the five-year average
Year-to-date LoveCatalina.com
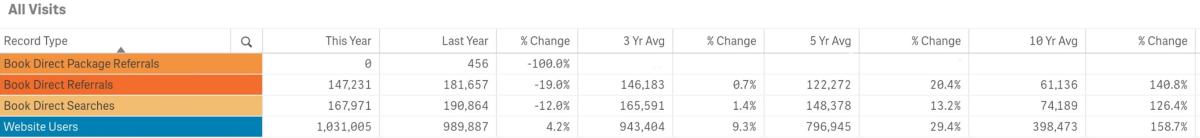
- LoveCatalina.com website users are up year-to-date by 4.2% @ 1,031,005 vs. 989,887 in 2021
- Book Direct lodging searches are down year-to-date by 12.0% @, 167,971 vs. 190,864 in 2021.
- Book Direct referrals year-to-date are down by 19.0% @ 147,231 vs. 181,657 in 2021
- Book Direct Package referrals are not currently active on our site
Note changes to Book Direct on member links has resulted in shifting some traffic to referrals vs. searches
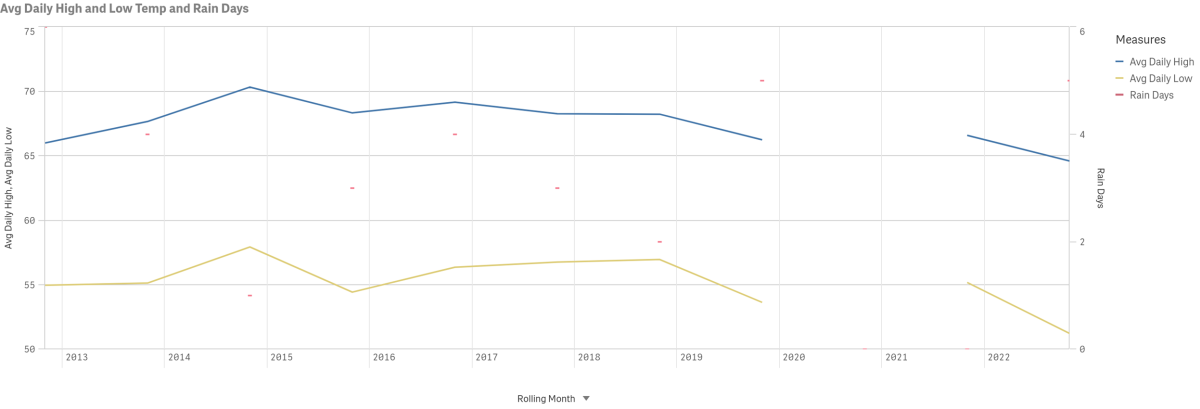
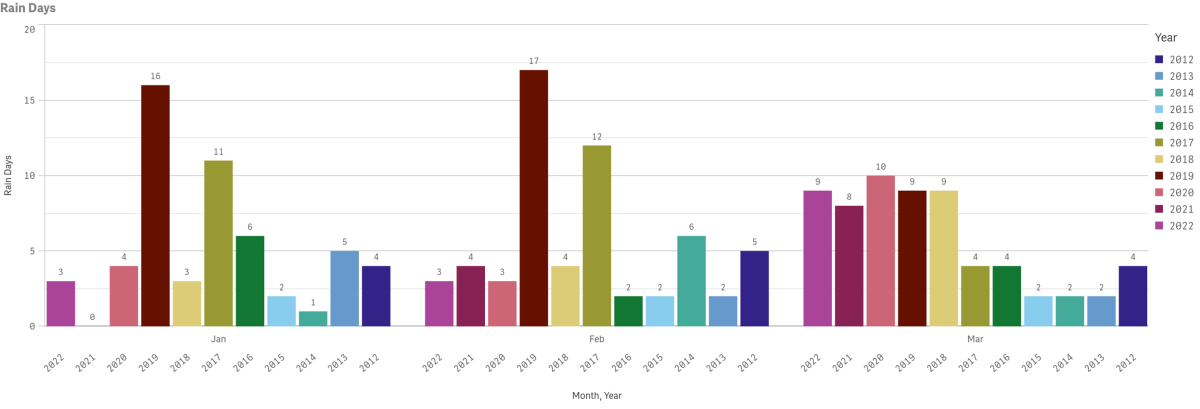
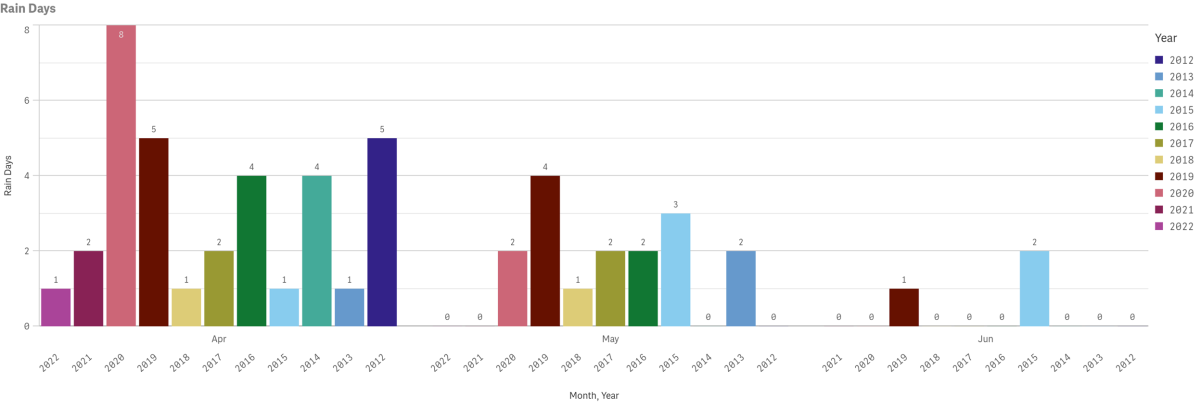
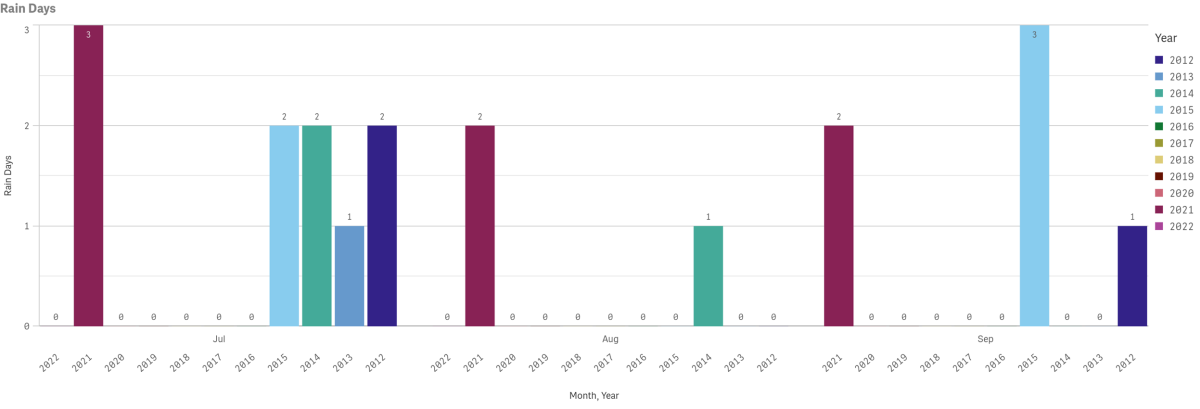
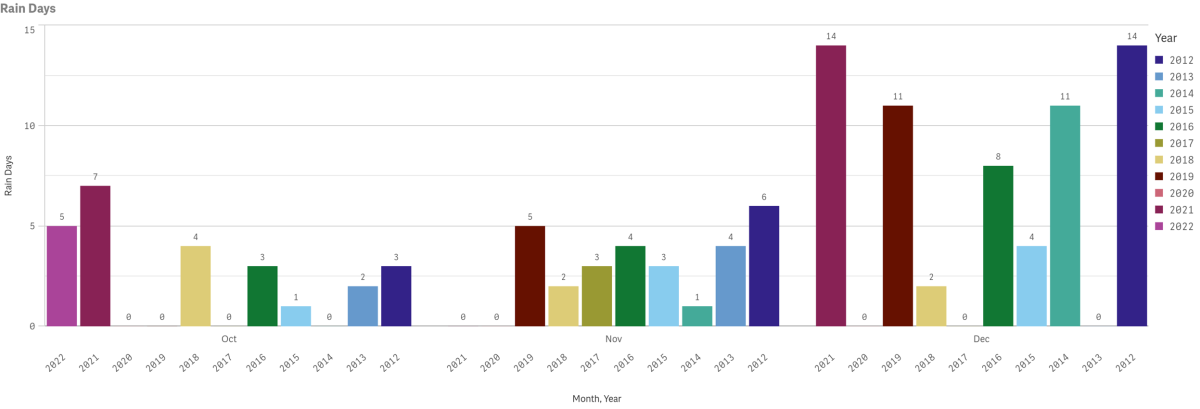
Weather
Data for November highs, lows and precipitation going back to 2012 is displayed below. Multi-year rain days data is also displayed by year and month since 2012. Measures are taken at Avalon Harbor. November 2020 highs and lows did not report.

Catalina Flyer from Newport
$10 Off Catalina Island Ferry
Hop onboard the Catalina Flyer for daily ferry service from Newport Beach to Avalon, Catalina Island in just over 1 hour.

Catalina Sea Spa
Recharge with massages starting at $110.
Discover Bliss at Catalina Sea Spa! Book online or call 310-510-8920. Treat yourself and escape to relaxation today!

